Thursday, December 27, 2007

Peaks and Valleys (Trading Naked)

Open up a line chart with average price on your ONE HOUR chart. Be sure to pick a color you like! Try and make the zoom pretty far out so you won’t be so distracted by the noise. What you want to look for are MAJOR peaks and valleys. What determines a “major” peak or valley is really up to the trader, but to me, it’s a noticeable change in direction.

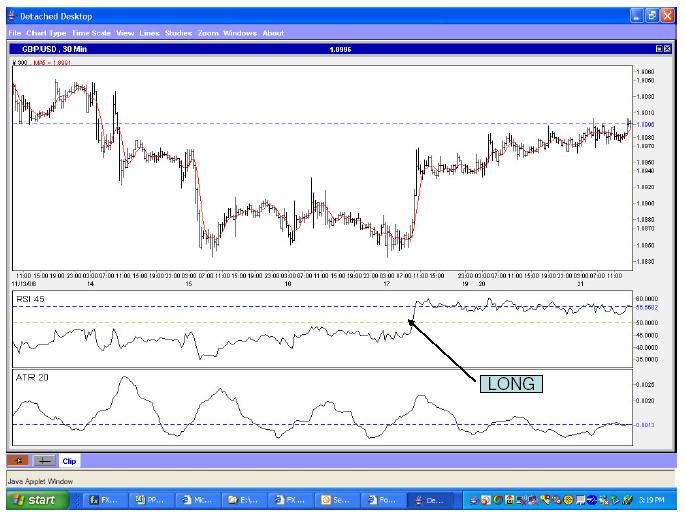
Near where the orange arrows are pointing are examples of valleys, and blue arrows point to peaks. The arrows are a bit inaccurate, but it’s the best I can do so bear with me. One could probably set a minimum wave size in terms of pips to determine whether or not a peak or valley would be “major”.

How to Make Pips With Peaks and Valleys

Peaks
• Place BUY orders 3 to 5 pips above each major peak (S/L = 50 pips + spread, no T/P).

When in a PEAK trade (LONG)
• Move your S/L along with each new valley point that exists (most recent valley point).
• Also, continue to place BUY/SELL orders as you go with the new peaks and valleys.

Valleys
• Place SELL orders 3 to 5 pips below each major valley (S/L = 50 pips + spread, no T/P).

When in a VALLEY trade (SHORT)
• Move your S/L along with each new peak point that exists (most recent peak point).
• Also, continue to place BUY/SELL orders as you go with the new peaks and valleys.

What we are effectively creating are trades that have a set allotted risk (50 pips) but have unlimited potential to grow (assuming the trend is your friend).

An Example
Pretend you’ve just woken up one fine morning, and this is the chart you have in front of you. Using Peaks and Valleys, what would I do? By the way, this is a live trade.


Most recently, we have 2 peaks at about the same price range. I usually do the higher of the two when it comes to peaks, and lower when it comes to valleys. We also have those two recent valleys right next to each other. No need for two orders in the same price range, so just do one BUY order by the highest recent peak, and one SELL order by the lowest recent valley. So what happened after we set up the orders? Well, truthfully, I went to sleep, but also we had a successful trade:

As you may or may not see, the pending BUY order I had placed earlier has now been triggered. As I woke up this morning and checked my chart, I realized that I had missed a long opportunity denoted at the green arrow. I also moved my S/L to the next valley just after the green arrow pointing to the peak, AND put in a short order for when/if my S/L is hit. This to me is a sign that the current trend has stopped producing higher high’s and low’s, and MAY be headed south instead.


Kevin Harvell
kharvell @ Forex Factory

Thursday, November 29, 2007

Pivot Point Squeeze Technique

The following forex trading system is a system based on constricted volatility followed by a breakout which co-insides with pivot points.

Forex indicators used:

Bollinger bands with MA of 18 and deviations of 2 through to 4.2
incrementing by 0.2
Bands 2 – 2.4 Purple
Bands 2.6 – 3 Pink
Bands 3.2 – 3.6 Red
Bands 3.8 – 4.2 Green

MACD with settings:
Short term MA: 5
Long term MA: 13
Signal number periods: 1

Bollinger Bandwidth with settings:
MA periods: 18
Standard deviation: 2


Indicator Settings

Trigger level
Horizontal line at a value which is determined by currency pair EUR/JPY ~ 0.0056

Pivot Deviation
Distance from a pivot point in which the signal is still valid - 14

MACD Threshold
Threshold of the deviation of the MACD that signals an exit - 6.2


Making sense of it all
The Bollinger bands are used to visually see the volatility of the underlying security. When they narrow, it shows that the market is not sure which way to push price. I.E no-one is buying or selling with urgency. When there is a lot of traders in the market to sell, you will see the market drop and the Bollinger bands increase in bandwidth. It is the same with an up-trending market as well.

It is the breakout of this constrictive time of the market that I use to enter the market. If this breakout is close to a pivot point, it makes the trade setup even more positive.


Entering a trade
The first thing to look for is the narrowing of the Bollinger bands. When the Bollinger bandwidth crosses under the trigger line, you want to keep an eye out for a low on the histogram followed by an increase in bandwidth. This is a signal that it maybe breaking out and that is the entry point. Enter the market long if the MACD is trending up or short if it is trending down. Put more simply, trade in the way that the market is breaking away.

When I enter a position, I enter a wide stop loss as the EUR/JPY can be volatile and go in the other direction before it trends in the predicted direction.


Exiting a trade
When the MACD histogram is starting to turn in the opposite direction of the trade with a certain threshold of this turn, it can signify an end to the rally. The threshold must be set at a level which is not too sensitive as to make you exit a longer profitable trade but not too lenient as to give much of your profits back. Experimenting with this level is the only way to know which is best for different pairs.

Another way to plan your exits is to stage out at differing pivot levels. Say you enter a trade when it breaks down from the Pivot point. You would exit say half your lots at the 1st support line and then move your stop loss up to entry. Then your remaining lots at the 2nd support.

Examples:

The top red bars show a short. The bottom indicator pink bars show short entries which do not take into account pivot points. The last trade on the right in which I am still in is turning out quite profitable, I just don’t enter with as many lots as if it did line up with the pivot points. You can see with the restriction of the bands on the right that something big was going to happen, the system tells you when it is time. I set up alarms on the indicator to alert me when to enter a trade. With different pairs I have different voices, so On EUR/JPY I hear “enter long EUROYEN” when the signal is given and “exit EUROYEN”. Pretty cool but enables me not to be glued to the screens, which can be hard to get away from…


Another short term trade short which resulted in a profit of 146 pips

-GCTrader1 from www.forexfactory-

Saturday, November 3, 2007

Daily 95 Pips Forex Strategy

The basis of this system is very simple and has proven to be profitable, though I am adjusting the money management/profit targets.

Overview

This is a pure "set and forget" system where trades are placed at the same time everyday. The option is also there for those inclined to monitor their positions to adjust stop levels as profit targets are reached. Please note that there is currently an Expert Advisor being created that will automate the trading of this strategy, thus keeping to the set and forget objective. Please click on the paperclip at the top right hand side of the screen to find the current versions.

By setting multiple profit targets we are exercising money management, while aiming for 95 pips profit from a 50 pips move in price. We will simply be placing orders 5 pips above the previous days HIGH and 5 pips below the previous days LOW.(Actually, it's more like the previous 17 hrs at 5 pm EST.). Use a 30 pips stop loss for all orders. Orders are placed on Monday, Tuesday, Wednesday, Thursday and Friday.

Execution

1.) At 5pm EST open the 1hr chart (2hrs b4 start of the Asian session) of USDJPY. For those whose brokers spreads are still wide at 5pm EST on Sunday (which is 7am my time on a Monday here in Brisbane), in order to avoid the wide spreads you may need to wait until they reduce to normal before placing the orders for the day. I typically have to wait until around 8pm EST.

2.) Use the high and low of the previous 17hrs. For Mondays orders go back as far as 00:00 EST on Friday for high and low.

3.) Open a total of 6 PENDING orders (for each pair) including 3 BUY STOPS and 3 SELL STOPS that expire within 24hrs (I use 18hrs) as follows:

Buy/Long Orders:
1 - Entry = HIGH+5pips, Take Profit=15pips, S/L=30pips
2 - Entry = HIGH+5pips, Take Profit=30pips, S/L=30pips
3 - Entry = HIGH+5pips, Take Profit=50pips, S/L=30pips

Sell/Short Orders:
1 - Entry = LOW-5pips, Take Profit=15pips, S/L=30pips
2 - Entry = LOW-5pips, Take Profit=30pips, S/L=30pips
3 - Entry = LOW-5pips, Take Profit=50pips, S/L=30pips

That's it!

Once you have placed your orders you are free to go and do something else with your day as this strategy does not require you to be monitoring the trades. Though, as already mentioned, to maximise results you may choose to adjust stop levels when profit targets are reached.

There can be 4 possible outcomes after either the long or short trades are triggered:
1.) All 3 profit targets are reached for a total of +95pips.
2.) The first 2 profit targets are reached (+45pips) and the remaining lot is stopped out (-30pips) leaving a total of +15pips.
3.) The first profit target is reached (+15pips) and the two remaining lots are stopped out for a total of -45pips.
4.) All 3 lots are stopped out for a total of -90pips.
Additional to this is the variable outcomes of when both the long and short trades are triggered.
Also note that for those so inclined to monitor the trades, stop levels may be adjusted on remaining lot/s to protect already achieved profits. Trailing stops may also be used at your discretion.

Please note that as a general rule of thumb you should not risk any more than 3% of your trading account on any one trade. Therefore, with the DAILY95PIPS strategy the order size will need to be divided between the long and short orders. The total potential loss on the long orders (90pips) will therefore add up to 3% of your trading account. Alternatively, you could risk 3% of your trading capital on EACH order, totalling 9% of your trading capital being risked for the long trades. The same applies to the short orders.

By: mikelath
www.forexfactory.com

Wednesday, October 31, 2007

Fibonacci Forex Trading Signal

The fact that Fibonacci numbers have found their way to Forex trading is hard to deny. Moreover, trading currencies with Fibonacci tool for many traders have become the bread and butter of their whole trading career. So, shall we look at the one of such good Forex trading systems today?

Trading setup and tools we need:
Time frame: 3 hour (or 4 hour).
Currency pairs: any.
Indicators:
Fibonacci tool - our main tool
EMA 100 – green (visual guidance)
SMA 150 – red (visual guidance)
RSI (14) on a daily chart

We will be working with next Fibonacci retracement levels: 0.382, 0.618, 0.250 and 0.750.
Default stop loss – roughly 100 pips and then adjusted according to the most recent swing high/low.
Profit target – no target is set as we will let the profits run.
Trading Rules:
Find the closest to the current price wave with a distance from High to Low over 100 pips.
Apply Fibonacci on it no matter if the wave is going up or down, only size matters.
Some terms we are going to use here:
The corridor between 0.382 Fibonacci retracement level and 0.618 retracement on the chart – will be called a “must channel”.
Fibonacci retracement levels will be numbered always from bottom to top, no matter whether it is an up or a down wave. E.g. at the bottom we will always have 0.250, then next 0.382, 0.618 and finally on top – 0.750 Fibonacci retracement level.
Entry rules:
Always enter only according with both:
1. EMA and SMA trend suggestion (e.g. green on top – uptrend, red on top - downtrend)
2. RSI suggestion (e.g. reading below 50 – only sell orders, above – only buy orders).

Now, after applying Fibonacci on a wave bigger than 100 pips we wait for the price to go inside a “must channel” area (at least to make 1 pip into the channel). Only then next rules will be valid:
- If a full candle (including shadows) is closed below 0.250 Fibonacci retracement, we go short. If we are currently long – it is time to close long position – it is an exit rule as well.
- If a full candle (including shadows) is closed above 0.750 Fibonacci retracement, we go long. If till this time we had short positions open – we close them – and again it is an exit rule as well.

Important: once another wave greater than 100 pips occur, set a new Fibonacci on the new wave. Retracement levels will change and so we will now follow new retracements.
(Optional: for visual aid traders may mark old Fibonacci wave to see the general pattern of consecutive waves on the chart).


click image to enlarge

That’s it. Stay in trade, resetting Fibonacci with each new wave and moving a stop loss according to the last swings high or low (in simple words, a stop loss will be always just below the Fibonacci 0% line) until it is time to close the position according to our rules.


This strategy prevents a lot of “bad” entries, eliminates early exits and allows staying in trade for a long period of time helping to take everything a current move can offer.
Traders may close all good winning positions on Friday evening if they prefer not to hold them over a weekend.

By: Edward Revy
www.forex-strategies-revealed.com

Sunday, October 14, 2007

IB Forex Trading - 40 to 100 Pips per Day

This forex system is very simple and requires only one indicator. The system works in anytime frame and with any pair. The Indicator you need is Slow Stochastic setting 8.3.3 some platforms will only allow 8.3 that’s ok.

Next the key part of the system in all trades is the INSIDE BAR or IB. An IB is simply when the current bar is less than or equal to the bar to the left of it. The inside bar can also be the same size as the previous bar.

klik to enlarge the picture

THE INSIDE BAR is a standard technical analysis pattern; however most people over look it. You can also use an outside bar or OB.

HOW TO TRADE THE IB
First look for an IB to form then check if it’s a valid IB with the stochastic indicator set up.

STOCASTIC INDICATOR SET UP
When stochastic are below or around the 20 and oversold and starting to hook round look for an IB to go long, When stochastic are up to 80 and above and starting to hook round in overbought look for an IB to go short you will find them the best in trending markets also range bound markets but if the price action is choppy stay out.

The Stochastic don't have to be exactly 80-20 but it is stronger signal if they are. Sometimes as an example they may at 35 as long as they start to turn and hook up and an IB forms it’s a possible valid trade.

ENTRY
To enter a trade wait for the next bar after the IB to go up 1-2 pips higher than the IB for a buy signal or 1-2 pips lower for a sell signal. Also the shadow of the IB must be inside the prior bar as well in the overall size otherwise it’s not a valid signal.

If after the IB formed you get another bar the same size as the IB and it doesn’t go 1-2 pips either way then you may look at up to 3 more bars after the IB bar to confirm a signal and enter a trade. If you don’t get a signal stand a side and wait for a new IB to form.


STOPS & EXITS
For stops and exits you can trail a stop at the bottom of the prior bar to the IB by 1-2 pips if you’re more Aggressive 2 bars below the prior bar to the IB.

Exit when stochastic cross in the opposite direction but becarefull when going long as when stochastic hits 80 it can hang around a while first before carrying on up or just staying flat in a strong up trend so wait for a hook down and heading under the 80 level or a reversal candle to exit. Also to exit look for the big numbers if you were trading GBP/USD. Try not to enter trades around the big numbers wait for price to go through and retrace to the support or resistance then look for an IB to form and take the trade.

I look at a 1 hour chart first and see what the over all trend for the day is going to be then trade off a 15 min chart for the day.

One of the benefits of this System is it can get you into trades early before the crowd. Once you have demo the system how would you like to trade live


James
Master Contributor and Member of BabyPips.com Forum

Monday, September 24, 2007

25 and 50 EMA Forex System

This is a basic 25 and 50 EMA forex system setup;
4 Hour Chart
EMA 25 (Green)
EMA 50 (Blue)
Relative Strenght Index -RSI (14)
Stochastic (5,3,3)
Average True Range (100)


FOREX ENTRY CRITERIA

Take LONG position when
1. A candlestick open/close above the 50 EMA line
2. RSI is at or above 50 center line


Take SHORT position when
1. A candlestick open/close below the 50 EMA
2. RSI is at or below 50 center line


STOP LOSSES AND MANAGEMENT

Stop losses in this forex system are relatively easy to set. From the point of entry add 1 x’s or 2 x’s the current ATR value.

Trade management is extremely important with this forex system. The initial profit taking target is between 50 and 100 pips. Regardless of what position you have open. Recommended is to close 50% of your profits at your first target and immediately move your SL to B/E.

This can sometimes lead to your position being closed out when the price retraces, leaving you out of trade and possibly missing a greater profit, but it is the safer way to trade.

Another risk management option is minimizing your SL by 50% once you hit your initial target of 50 – 100 pips.

The remainder of the position is left to trail for profits. It is closed out either at historical S/R or at the cross/touching off Stochastic on the 4 Hour Chart. We do not trade on any time frame smaller than the 4 Hour Chart.

I recommend you move your SL from B/E to newly created S/R every time the price moves in your direction so you can better trail it. Of course you may also use an automated trailing order.

The important thing is to take profit at 50-100 pips after your entry on the candlestick open. Fake outs do occur, but when we take profit at 50 – 100 and move to B/E we are safe even at full price reverse.

This is an H4 System, trades will occur very often, You can expect 100 to +1000 pips.

Recommended to trade GBP JPY or EURJPY due to their volatility and NZDUSD because it trends steadily.


EXIT OPTIMIZATION

In many instances you will be forced to sacrifice more pips for the safer approach to forex trading. I’ve implemented the use of the Stochastic indicator when trading 25-50 EMA System so you can pinpoint an area on the chart which will leave you exiting your remaining position at a level you normally wount be able to capitalize on due to risk management.

Every time the Stochastic indicator begins touching or crossing you should consider exiting as the price may be pulling back. Naturally with this also occurs the occasion in which the price pulls back but does not close under the 50 EMA, leaving you out of a trade and probably having you wish you never exited in the first place. To capitalize on the bounce an minimize loosing to many pips we take advantage of the 25 EMA.

When price corrects, it will normally test the 50 EMA, if it does not break you will be looking to reenter, however an immediate reentry or an entry off a close/open after the bounce from 50 may often be false. In order to reduce this, we wait for price to close above 25 EMA before attempting another Long in the same direction of our previous trade. I recommend having a crossing or a touching of the Stochastic Indicator complement the open/close above 25 EMA when considering a reentry. Yes.. pips will be missed, but it is the least dangerous approach to the problem.

On the next picture you will see (in order of appearance) an entry, a first exit optimization area, a trade reentry based on 25 EMA and another Ex. Op. area.


The idea here is to move you SL to a LOW every time the price breaks a High (BULLISH) and vice versa: move your SL to a HIGH every the price breaks a low (BEARISH). Use Exit Optimizing when necessary.


Regards,
E. Lang
www.forexfactory.com

Monday, August 6, 2007

4 Hour Simple System

This is a simple one that I have found from forexfactory forum, it seem good system to try

Setting :

Simple Moving Average (SMA) 100
Damiani Volatmeter 10,60,1.4 (download Damiani volatmeter here)
MACD - 15,26,9
4 hour chart
Pairs EURCHF (it has a medium level volatility and it does not get trapped between news, though it reacts mildly but it could be worth checking the other pairs)


System Rules

Long:
Take a long trade when price closes above 100 SMA and MACD histogram goes above 0 line.

Short:
Take a short trade when price closes below the 100 SMA and MACD goes below 0 line.

Re-entry:
When the price, once has given a long or short signal, retraces back to the 100 SMA, re-enter the direction you went the first time. It is recommended to do it the first 2 times the price hits the 100 SMA and keep a watch thereafter.

Retrace entry:
When a bar is over 100 pips, wait for a retracement to occur towards the 100 SMA line and then enter. This will save you from unnecessary draw down.

Exit rule

Scaling:
Take 3 positions per trade. Set first TP to 40, 2nd TP to 70 and let the third position run with Stoploss at breakeven.

Stop loss:
1. Previous high/ low or what you call as support and resistance.
2. AutoPivot Indicator. Use only the weekly option in it and place stop accordingly.

Filter

This is a trend following system, and has it's bad days. To avoid getting trapped in a range, use the Volatmeter indicator. It is, so far the best indicator to helps detect a ranging a trending market. In volatmeter indicator watch when the white line crosses above the green, It mean the market beginning a range or already entered into it. When the green line crosses above the white line, market getting into a trend, this is what we looking for to take short position or long position.

As an example; once trade hits the first target, moved the second position to breakeven and leave the third as it is. When the 2nd position is hit, move the 3rd to breakeven, giving the trade enough room to breathe. Then look for the price to come back, to add to the position, if it is open. At times, when price comes back to the 100 SMA, get stopped out at breakeven, it has given 100 pips on 2 positions.

Another example

The blue box is the main entry and the yellow, you can see, is the re-entry.


By Marketsnipers from www.forexfactory.com

Tuesday, July 24, 2007

Cornflower Hourly System

Construct a template according to the following settings:
8 EMA (yellow, dotted)
12 EMA (violet)
24 EMA (cornflower blue, hence the name)
72 EMA (khaki)

Apply to H1 (conservative) or M30 (aggressive) chart only and remove the grid for clarity.

System principles
Cornflower is based on the principle that trades should be taken when the same trend presents itself on multiple timeframes. On an hourly chart, the 24 EMA obviously defines the daily trend. The 8 EMA, which is one-third the length, shows the intraday velocity of “fast” money. A 12 EMA shows the trend of the last half-day. Its value is a place at which price will typically find support when there is a dominant trend. To a lesser extent, this also applies to the 24 EMA. A long-term trend will sometimes catch a breather around this area, with big money accumulating on the opportunity to buy or sell at a substantial discount. Finally, the 72 EMA defines the dominant trend in the market. This trend will reassert itself as cumulative memory persuades traders to resume trading in its direction. If the three shorter-term averages are above the 72 EMA, we are in an uptrend and should not go short. The same applies in reverse for a downtrend.

Cornflower can be used in a number of ways by all kinds of traders. When price pulls back to the area between the 12 and 24 EMAs, the opportunity for a short- to medium-term bounce presents itself. We can enter and set a profit target based on a number of criteria, be they support and resistance areas, pivot points, or a set pip amount. Or we can enter a longer-term trade, perhaps exiting when the 12 EMA crosses down below the 24 EMA. The longer-term setups in this system are powerful and can yield hundreds of pips on a single trade that will last for up to two weeks. Cornflower will catch every major move in the market, providing multiple opportunities to take advantage of a big trend and pretend that one is a bank trader.

Basic System Rules
There are two kinds of entries using this system: pullback (conservative) and initial (aggressive). The pullback entry, which is the heart of this system, enters the market when conditions are quiet and after price has settled into the area between the 8 and 24 EMAs. The timing of this entry can either be mechanical (using either the 12 or 24 EMA) or discretionary in accordance with the trader’s judgment on whether price is moving back in the direction of the trend.

The initial entry aims to capitalize on the first movement of a new trend, defined by a thrust beyond the 72 EMA that is confirmed by a turnaround in the shorter EMAs. It is more risky because there is always the possibility of a reversal. For this reason, it is probably better to use the M30 chart for this type of entry. Moved up by 30 minutes, one has the opportunity to take a small profit or scratch a trade at or near break-even if a reversal presents itself.

Only the H1 and M30 charts should be used with the Cornflower template. Shorter time periods will lead to whipsaws, whereas longer time periods lag behind the market too much.

The following rules are valid no matter the time of day. The quiet of the Asian session actually provides some excellent opportunities for entry, which is a boon for the trader whose day job makes watching the market during London or New York an impossibility.

Pullback (conservative) entry – use hourly chart
·8, 12, and 24 EMAs are all above (long) or below (short) the 72 EMA
·Price has pulled back to the 12 or 24 EMA (the more aggressive the trend, the more shallow the pullback.
·Enter for 20 pips, or hold depending on trader’s judgment of the strength of the trend.

Initial (aggressive) entry – use M30 chart with identical indicators
·Price has moved with authority above or below the 72 EMA. By “moved with authority,” I mean a candle that has closed near the top of its range.
·8, 12, 24 EMAs are all pointed in the direction of price, and preferably already stacked in a perfect order (8 over 12 over 24 for long, 24 over 12 over 8 for short).
·Enter for 20 pips and hold if the thrust develops into a real trend.

Using hourly and half-hourly charts, 20 pips is a realistic initial profit target, especially if one is trading GBPUSD, GBPJPY, or EURJPY. Even the other major pairs should yield this much on a properly gauged signal. By “major,” I mean EURUSD, USDCHF, AUDUSD, USDJPY, NZDUSD, and USDCAD. With the possible exception of EURGBP, any pair that involves two of the seven major currencies should be tradable with this system. Cornflower is particularly well-suited for entering long positions on the yen crosses (carry trades).

Entries may be timed more precisely with a 5M timeframe. More on this later.

-felicia- www.forexfactory.com

Thursday, June 21, 2007

Nobrainers Forex Strategy

Nobrainer forex trading strategy has proposed by someone who called Vynner in forex trading communiy forum www.forexfactory.com, it seems that this strategy attracted a lot of trader on that community. Because this strategy was easy and simple to use. Vynner said he has use this simple forex strategy from June 2006 and gave him 300 -400 pips a months.

Here is the system :

Things you need:
1) Daily Chart on GBP/USD
2) 4 hours Chart on GBP/USD
3) Slow Stochatics (13,5,5) on both charts
4) EMA 4, EMA13, EMA50 on the 4 hours chart

Look at 4 hours chart
Entry:
When the EMA4 first cross the EMA50 follow by EMA13 cross the EMA50, with a new open candle, place your entry with a stop loss of 50pips.
Exit :
When EMA4 reverse and cross the EMA13 on the next open candle.

They call this the NoBrainersTrade but Vynner has modified a few things and add in a really good filter base on the daily charts with slow stochastics.

For Filter look at Daily chart
Valid Long Entry:
Slow %K above Slow %D on the Daily Chart
Valid Short Entry:
Slow %D above Slow %K on the Daily Chart

"Very simple method but yet powerful. It works on other pairs too but I found this work best on GBP/USD" ---VyNNer----


Friday, May 25, 2007

The Daily Fozzy Method

The daily fozzy method is another forex system which is a low maintenance and very easy to follow. It was started on Forex Factory by Fozzy from Australia. He developed this strategy on his own, and it targets those who cannot sit in front of their computers all day, just waiting for signals. All it needs from you is a 10 minutes every day.

Fozzy Method only trade daily charts and only EUR/USD, GBP/USD, USD/JPY and USD/CHF. Why these? Primarily because these are the only ones Fozzy has backtested and He has been trading for the last 3 months. He also tend not to trade Monday mornings (Australian time) as prices sometimes gap over the weekend. However, this is discretionary.

On each chart He has an 8 period RSI. He has also has an 8 period MA of the RSI and Bollinger Bands with a 20 period setting, also on the RSI.

Long Entries: When RSI below the middle Bollinger Band. Enter long on the open of the next bar after the RSI has crossed MA from below to above.
Short entries: When RSI above the middle Bollinger Band. Enter when RSI crosses MA from above to below.

Stop loss is the low/high of the previous bar. Move S/L to break even if the price moves greater than 40 pips in Our direction. After the initial 40 pip move use a trailing stop for exits (25 pips).

Fozzy only look at the charts once per day, just before 0.00 GMT. This way He knows which pairs are approaching his set-up. Then place trades if the criteria has been met. That's it.

A simple system that seems to work for him. This method provides a limited number of trades but the trades can last anywhere from 1 day to numerous days. There can also be days on end with no trades. He has found that the secret is have patience. He also have come to believe those who say longer timeframes are easier, especially for newbies.

He said "This system will not always work but for me it has generated over 400 pips in September already. Please try this out on demos before putting your hard-earned into it. Just because it is working for me (at the moment) does not mean it will suit everyone".

Tuesday, February 13, 2007

Galveston Forex - 5 Minute Chart Trading Strategy

Rules of Engagement of Galvestone Forex Trading System :

1. The range of your last few high/low points is more than 20 pips. High/Low points on our charts are indicated by the red (high) and blue (low) circles. (also called “Mouteki 2 bar high/low points”) These are a high or low point with two bars on each side of them that didn’t make a new high or new low. We don’t use all red and blue circles when deciding if 20+ pips has been reached, we mainly use the points that have shown very little retracement. The exception to this rule is only if your potential trade is in the direction of the overall trend. If so, less than a 20 pip range could still be acceptable, provided the other variables match.

2. Trade the right side of the range. If you are planning to go long, your entry would be in the bottom half of the range between your last few high/low points-closer to the low of the range. When shorting a currency, it would be the top end of the range. If you are in the direction of the overall trend then this rule is less important.

3. Before placing a trade, wait for a breakthrough of any decent support or resistance that’s nearby. Ideally, we like to see double confirmations. If there is a break of the trend line, we like to wait for a break of the nearest support or resistance as well. We do this to avoid reversing our position on what is likely a small retracement. On our chart we have two examples of this. The first trade breaks the trend line followed by a breakthrough of the resistance. The second trade breaks through the support and then the trend line. During the upward move, we also have retracements that break the trend line, but not the support line, therefore we never reversed our trade.

4. Draw smooth trend lines-use clean points with no previous breakthrough. This is important because we think that once the price passes through it, the integrity of the trend line has been weakened. Once a price breaks through our trend line, we modify our trend line according to the previous break. We take our original point and use the high or low of the violation bar as our next point. We then draw a trend line between the old line and the new line, because we would still consider entering that trade on a double confirmation. If the trend line is strong, and the price pulls away from it, only to come back and pass through it, we don’t need a double confirmation. We would consider entering the trade without it, if there are no support or resistance points in the area around the breakthrough.

5. If our trade is going really well, and the trend line looks pretty steep, we often change our strategy a little. We would not be looking to stop and reverse as usual, but be more concerned with not giving back all of our profits. If your price targets have been reached or you feel you are coming up on a strong support or resistance, then feel free to exit the trade. We like to give the trade a chance, usually waiting for a trend line violation or an opposite support or resistance break though. Sometimes there will be no mouteki price points or trend lines in the immediate area, so we look for technical reversal points to exit our trades with still a decent profit while at the same time giving our trade room to breathe.

6. Be conservative on choppy days or days when bars have consistent long shadows. The Forex usually follows some daily pattern, until, of course, it is broken. Because of that some days will be very easy to trade and profitable, and others will be difficult. For the most part the market will be fairly easy to trade and profit from because of the very large daily pip range. The sooner we recognize the type of market we are in the sooner we can adapt our trading strategy to it. One way we can “adapt” is by utilizing smaller stops when the market is trending tightly, and using better positioned stops when the market is more volatile. If we see a ranging market, then we can look to enter on a single confirmation closer to the top or bottom the range. It is easy to trade according to rules, however it is more difficult to recognize and adapt to the current market conditions. By using adaptive rules we can better play specific market conditions.

7. Use technical points for stops. There is no need to risk more than 15 pips on a trade when using a 5 minute chart. If you decide the risk is worth the reward then virtually any stop can be justified, but be aware of the next major support or resistance, as that will likely be your first target or obstacle. Ideally, our stops will be on the opposite side of the top/bottom range point nearest to our trade. If this is not possible then we will try and place our stops just beyond the nearest support or resistance levels that we can find that are within reason. Remember to add your spread (2 pips) and a buffer zone (1-3 pips) to the support or resistance you chose to put your stop behind. The basic idea is that our trades have 3 possible scenarios, 2 of them going our way. The trade could move against us and break out past our technical point; we lose. The trade could move against us, hit our technical point and reverse back, moving our way; we win. The trade could move in our direction; we win.

8. Managing stops can be the biggest determinate between making money and losing money. If we trail our trade tightly, we increase the chance of making a small profit, but reduce the likeliness of making a big profit. Small profits are good, however, if we consistently get stopped out at +5 or so, and are willing to risk 15 pips on the downside, it will be tough to make decent money. More often than not we would miss the big runs. With that said, we need to be intelligent about our stops, both in placing them as well as managing them. Ideally, we just close our trade and take a position the other way. If we are using a trailing stop loss, we need to keep our distance and always place stops behind strong support/resistance points. We trail our stops if we think our stop is in a weak position. The stronger we feel our stop is, the less likely we are to move it (unless the trade moves into good profit.) One strategy that makes stops easier to manage is trading two lots. The first lot we look to exit at the first likely reversal point, thereby locking in profit, (or at least offsetting any potential moves that stop you out.) Trading two positions can free you up mentally by satisfying your need for locked in profits, but also allowing you an opportunity to see your trade run as well.

9. Trading bigger ranges and trading with the overall trend will reduce your risk and dramatically increase the probability of a successful trade. Like we stated earlier trading two or more positions also increases your chance of success. Remember that the trend is more likely to continue than it is to reverse.

10. Do not force or create trades. Wait for the market to dictate when you trade. This rule is the difference between following a strategy and “just winging it”. Modifications can be great, but entering early, really late, or placing large stop losses are recipes for disaster if not thought through.


These Rules of Engagement are based on the results of one lot trading with a few adaptive variables, (e.g. stops and limits.) We have NOT tested trading only with the trend, or trading only large movements. Refer to our recent chart example for a better idea of our strategy.


Additional Information:

Q: When using a 5 minute chart are we not just giving spreads to our broker?
A: That depends on the currency pair. For the EUR/USD, our spread is around 1.5-3 pips, which is a fraction of our allowed stop loss. We want to position ourselves for the larger moves, but even with smaller moves we can overcome a 2-3 pip spread easily. We don’t enjoy paying a spread, but it is a factor that most intraday trading strategies must deal with and overcome.

Q: Why use such a small chart; wouldn’t the 15 or 30 min be better?
A: The 5 minute chart is both the 15 and the 30 minute chart it’s just a matter of how you look at it. Three 5 minute bars are a 15 minute bar, and six 5 minute bars are a 30 minute bar. The 15-30-60 minute charts can’t tell you about a 5 minute chart, and a 5 minute chart can tell you what the 15/30/60 minute charts tell you. That’s why we use it.

Q: Why don’t you use any technical indicators along with your charts?
A: We would be happy to if you know some that would correlate with the strategy that we are trading, and that would act as a confirmation of when to enter or exit a trade. We are trying to keep trading relatively simple; “if this, then that”

Q: Why do you use trend lines along with supports and resistance points?
A: Trend lines give us a glimpse of the possible future, and supports and resistances open or close certain actions within that possible future. The idea isn’t to use a moving average to tell us what we already know; rather the point is to gather information on what we don’t currently know and using that information to predict probable directions of the market.


Final Note:

The point and goal of all of this is to simply make pips, individually and collectively. How we get to that point doesn’t matter, what does is that we make it there. Please test, tweak, develop, and create towards our goal of group success. It is difficult to put onto paper a set of rules that work, because often the market gives us hints on what’s going to happen and opportunities that we could seize but our rules don’t allow for us to do it. It is for that reason that we are working on two other strategies to fill the voids that this one leaves. Our other strategies in progress are for trading supports & resistances and trading range breakouts. You will see that sometimes we miss big trades because we followed our rules, so utilizing multiple strategies just makes sense. We will revise and update these strategy rules in the near future, but for now, please look over this strategy. Test it. Modify it. Do whatever you wish with it! We look forward to any constructive criticism or suggestions or how to make it better. Feel free to stop by our group site or shoot us an email. Thank you for taking the time to read this, have a fantastic Holiday and we wish you the best of luck in 2007.

Galveston ,-

Wednesday, January 24, 2007

Part Time Wealth Building Trading System

This forex trading strategy which is great for people who work full time but want to build a very lucrative part time forex trading addiction into full time profession from the comforts of their job:

1. 30 Min chart

2. 5 Period SMA

3. 45 RSI

4. 21 Average True Range (This is a volatility metrics to help determine lot size)

5. Use a 50 PIP stop.


Get Long (buy) position when the price exceeds the SMA by 5 PIPS for the first time and the RSI is greater than 50. Get Short (sell) position when the price fall below the SMA by 5 pips for the first time and the RSI is less than 50. The target for this system is always 200 PIPs (which I am currently enjoying with the GBP/USD).


Example:


The ATR is used to determine lot size. Lot size or Money Management is by far the most important concept to trading.


Happy Trading,


Tkimble (from ForexFactory.com)

Part Time Wealth Building Trading System (Scalping)

Weekly Forex Scalping Strategy

Weekly forex scalping system is very simple. Create a weekly chart on your forex chart. Place trades 50 PIPS above or below the close for the previous week. Use 30 PIP trailing stops. No profit targets. Let the trade run for the entire week and close during the final 30 minutes of the market for the week. The great feature of this system is that more often than not the weekly trend will establish itself and stay in tact from the Monday or Tuesday of the trading session for that week.


GBP/USD Example:
Previous weekly close: 1.9597
Buy: 1.9647
Sell: 1.9547


The following rule is a bit different than most trading systems of this style:
If the "Buy" is executed, move the sell up to the previous weeks close (1.9597 in this case). If the "Sell" is executed, move the buy down to the previous weeks close (in this case likewise 1.9597)


These two rules permit a more robust and agressive entry after losing trades.
Recommend volatile markets (USD/CHF, GPB/USD, etc.)
Here is the current trade that I am in using the GPB/USD:


This system averages approximately 150 pips per week in the GBP/USD market without any intervention. I am a big believer that most people over trade the market. This system will minimize your trades by its very nature.


Daily Scalping

Daily trading rule are as follows:


1. Create daily chart on any pair

2. Enter Buy/Sell order upon Sunday or Monday open at 2400 GMT. Order should be consistent with previous days trend (i.e; Previous day up, Place "Buy" market order, Previous day down, enter "Sell" market order at open)

3. Place opposite side trade 40 PIPS aways from initial market order (i.e.; if initial order was a Buy Place immediate Sell side order 40 PIP away from initial market entry)

4. If same trend for three consecutive days, place next days open order opposite of previous three days trend. i.e; If Monday, Tuesday and Wednesday were up days, Thursday would be a Sell order.

5. Use 40 PIP stops on all orders.

6. Close between 2300 GMT and 2400 GMT.

7. Repeat trade rules at 2400 GMT.


No straddling the price entry. Enter market immediately with 40 PIP reversal companion order.


Happy Trading,

Tkimble from forexfactory.com

Tuesday, January 16, 2007

Pivot Point Trading

Using pivot points as a trading strategy has been around for a long time and was originally used by floor traders. This was a nice simple way for floor traders to have some idea of where the market was heading during the course of the day with only a few simple calculations.

The pivot point is the level at which the market direction changes for the day. Using some simple arithmetic and the previous days high, low and close, a series of points are derived. These points can be critical support and resistance levels.

The pivot level and levels calculated from that are collectively known as pivot levels.

Every day the market you are following has an open, high, low and a close for the day (some markets like forex are 24 hours but generally use 5pm EST as the open and close). This information basically contains all the data you need to calculate the pivot levels.

The reason pivot points are so popular is that they are predictive as opposed to lagging. You use the information of the previous day to calculate potential turning points for the day you are about to trade (present day).

Because so many traders follow pivot points you will often find that the market reacts at these levels. This give you an opportunity to trade.

If you would rather work the pivot points out by yourself, the formula I use is below:

Resistance 3 = High + 2*(Pivot - Low)
Resistance 2 = Pivot + (R1 - S1)
Resistance 1 = 2 * Pivot - Low
Pivot Point = ( High + Close + Low )/3
Support 1 = 2 * Pivot - High
Support 2 = Pivot - (R1 - S1)
Support 3 = Low - 2*(High - Pivot)

As you can see from the above formula, just by having the previous days high, low and close you eventually finish up with 7 points, 3 resistance levels, 3 support levels and the actual pivot point.
If the market opens above the pivot point then the bias for the day is for long trades as long as price remains above the pivot point. If the market opens below the pivot point then the bias for the day is for short trades as long as the market remains below the pivot point.

The three most important pivot points are R1, S1 and the actual pivot point.

The general idea behind trading pivot points is to look for a reversal or break of R1 or S1. By the time the market reaches R2,R3 or S2,S3 the market will already be overbought or oversold and these levels should be used for exits rather than entries.

A perfect set up would be for the market to open above the pivot level and then stall slightly at R1 then go on to R2. You would enter on a break of R1 with a target of R2 and if the market was really strong close half at R2 and target R3 with the remainder of your position.

Unfortunately life is not that simple and we have to deal with each trading day the best way we can. I have picked a day at random from last week and what follows are some ideas on how you could have traded that day using pivot points.

On the 12th August 04 the Euro/Dollar (EUR/USD) had the following:
High - 1.2297
Low - 1.2213
Close - 1.2249

This gave us:

Resistance 3 = 1.2377
Resistance 2 = 1.2337
Resistance 1 = 1.2293
Pivot Point = 1.2253
Support 1 = 1.2209
Support 2 = 1.2169
Support 3 = 1.2125

Have a look at the 5 minute chart below


The green line is the pivot point. The blue lines are resistance levels R1,R2 and R3. The red lines are support levels S1,S2 and S3.

There are loads of ways to trade this day using pivot points but I shall walk you through a few of them and discuss why some are good in certain situations and why some are bad.

The Breakout Trade

At the beginning of the day we were below the pivot point, so our bias is for short trades. A channel formed so you would be looking for a break out of the channel, preferably to the downside. In this type of trade you would have your sell entry order just below the lower channel line with a stop order just above the upper channel line and a target of S1. The problem on this day was that, S1 was very close to the breakout level and there was just not enough meat in the trade (13 pips). This cab be a good entry technique for you. Just because it was not suitable this day, does not mean it will not be suitable the next day.


The Pullback Trade

This is one of my favorite set ups. The market passes through S1 and then pulls back. An entry order is placed below support, which in this case was the most recent low before the pullback. A stop is then placed above the pullback (the most recent high - peak) and a target set for S2. The problem again, on this day was that the target of S2 was to close, and the market never took out the previous support, which tells us that the market sentiment is beginning to change.


Advanced

As I mentioned earlier, there are lots of ways to trade with pivot points. A more advanced method is to use the cross of two moving averages as a confirmation of a breakout. You can even use combinations of indicators to help you make a decision. It might be the cross of two averages and also MACD must be in buy mode.

In the example below the market passed through S1 and then retraced to the S1 line again. It then formed a channel. At around this time we had a cross of the averages, MACD signaled buy and there was a breakout of the channel line. This gave a great signal to go long with a target of the original pivot line.

Mess around with a few of your favorite indicators to help determine an entry around a pivot level but remember the signal is a break of a level and the indicators are just confirmation.


We haven't even got into patterns around pivot levels or failures but that is not the point of this lesson. I just want to introduce another possible way for you to trade.

Good Trading
Mark McRae

Monday, January 15, 2007

The Tlatomi Method

In nahuatl (aztec language), tlatomi means ''to win money''

SETUP
1 - 4 Hour chart (This system works best with GBP/USD, GBP/JPY)
2 - NonLagMa_v4
● Filter=20
● Color=1
● ColorBarBack=0

SHI_SilverTrendSig
● Allbars=0
● Otstup=30
● Per=9.0
● Don't forget to change the colors also (0=blue-1=red)

FX Sniper's Ergodic_CCI_Trigger
● pq=4
● pr=8
● ps=5
● trigger=4

Entry
Enter long when :
1 – a blue dot appears
2 – the ergodic CCI crosses up the trigger line ( blue line crosses up the red one )
3 – NonLagMa color changes to yellow
Enter short when :
1 – a red dot appears
2 – the ergodic CCI crosses down the trigger line ( red line crosses down the blue one )
3 – NonLagMa color changes to yellow

Exit
Exit when a new dot appears (red if you are long and blue if you are short). This method gives you mecanicals trades. Don't hesitate to transform them into a discretionnay trade after because you can see things that the system can't. Sometimes, it will be the difference between a 30 pips trade and a 300 pips trade. Once you move your stop to breakeven and add a trailing stop – you can't wait alittle more time to see what the market wants to give you. Stop In general, I look for previous daily Resistance-Support but I don't have only one method for my stops. You can also looks for the high or low of the previous bar.

Remarks
Price enter :
The price enter is the open price of the candle or bars where the NonLagMa is yellow.

Ergodic_CCI :
The signal is stronger when the FX Sniper's Ergodic_CCI_Trigge is above 300 or under -300.

NonLagMa :
''The non-lag MA does turn yellow/non yellow while the current candle/bar is still forming ... so I wouldn't enter a trade until the end of the current candle confirms that the yellow section doesn't switch back to a non signal. So remember wait till the candle is fully formed until entering a potential trade!!!!''

To be more conservative means less profit but also more safety.
The order : I don't take a trade when the cross happens before the dot or when the cross happens after the nonlag. So, I wait for a dot then for the cross and then for the nonlag.
It doesn't matter if the cross and the nonlag happen at the same time but like i said earlier, the cross should never happen after the nonlag.

Swing Trading Strategy

This is a strategy that can be used on any timeframe, but personally, I prefer the hourly or 4 hours charts. The objective is to buy pullbacks during an uptrend and sell pullups during a downtrend.

1) Plot a 144 period moving average, triangular, exponential, weighted, adapted, whatever. Type of MA has no big importance, we use it to provide a price level only.
2) Plot pivot highs/lows
3) Plot a Laguerre RSI with default values (weighted close, .62) (not necessary, can be used as additional confirmation)

4) If price is above the MA we look to go long, if below, we look to go short
5) Draw a fib retracement (with 38.2, 50, 61.8 and 78.6%) level on the last significant swing
5) Wait for market to return back to the MA (important there should be at least 2 pivot highs during a pullback or 2 pivot lows during a pullup, see below)


6) Draw a tentative trendline through pivots highs/lows. This trendline should not be penetrated until price reaches the MA (otherwise you should cancel and replace)

7) Enter after a break of the trendline, after rebound on fibo/MA level (Laguerre RSI can be used for confirmation)
8) If long set the stop 1 pip below the most recent pivot low, if short set it 1 pip above the most recent pivot high (don't forget to include spread, if needed)

9) Immediately after taking the position, draw a new fibo retracement (38.2/50/61.8/78.6) on the last pullback/pullup

10) Trailing stop rules:
When price reaches 38.2%, set stop at breakeven
When price reaches 50%, set stop 1 pip below (if long) or above (if short) 38.2% level
When price reaches 61.8%, set stop 1 pip below (if long) or above (if short) 50% level
When price reaches 78.6%, set stop 1 pip below (if long) or above (if short) 61.8% level
When price reaches 100%, set stop below (if long) or above (if short) 78.6% level
If price breaks the 100% retracement, then set stop 1 pip above/below previous bar's high/low (note, if the 78.6% stop is closer, then don't move the stop)


Source By Mike

Saturday, January 13, 2007

Key Features for Shaping a Forex Day Trade

Until recent years, the opportunity to put on a trade was governed by the cycle of day and night. But a unique characteristic of Forex trading is its round the clock sequence of trading. Starting Sunday when the sun rises in Asia, until Friday late afternoon, when the New York markets close, Forex trading is available. So the question arises, what is a Day trade in Forex, if technically Forex is a continuous week of trading? To answer that question we do not need to delve into the nature of human circadian biorhythms. One has to be arbitrary. We can effectively define a Forex day trade as a trade that is completed during the waking hours of a trader. A day trade might also be considered a trade initiated and completed within the trading hours of either the Asian, European, or United States equity markets. One more criteria for calibrating when your Forex Day trading starts can be when you grab that first cup of coffee!

Your State of Mind is a Critical Factor
One of the differences between a beginning and a more experienced trader is their mind-set. In the mind of the beginning Forex trader is the ever present thought: What should I trade today? How do I get my 10 PIPS? In contrast, the more experienced Forex trader is looking to answer a different set of questions- Which pair offers the best opportunity for a winning trade? The beginner wants to jump in, score and get out. The more experienced Day Trader wants to wait for the market to come to them. The beginning trader perceives the Day Trade as a reprieve from analysis, whereas the more experienced trader knows that the trade itself is a result of analysis.

The search for your next Day trade starts ironically by looking backward in time.
We start by looking for the location where the price is probing or testing a pattern; a key Fib Resistance or Support area; trend line or moving average. In a real sense, your next day trade takes its shape days, and sometimes weeks, before the decision to trade. For example, if a currency pair is approaching a key Weekly 61.8% Fibonacci level, while another currency pair is simply moving between Fib levels, the pair that is nearer the Fib levels should take priority. It offers a greater trading opportunity because when prices are at these Fib locations, they are more likely to result a real change in sentiment and trend patterns.

Finding your next Day trade is a result of applying some key decision rules. The actual trigger conditions for the trade will wait for the right confirming moment. However, the chart below outlines the logical steps that go into shaping a Day trade. This chart describes two key steps in arriving at a trading decision. The first step is to answer the question- What is the major trend direction? The trader needs to observe the big picture in getting this answer and assess Weekly, Daily, and 4 hour patterns. The next important step is to decide what will be the direction of the next trade. Will it be a buy or sell? By choosing the direction of your next trade, you are not predicting the market at all. You are waiting for the market to come to you!


Number of Trading Opportunities Per Day Depends on Finding Patterns
An attractive aspect of the Forex market is plethora of opportunities to trade during a day. Let's try to quantify how many good opportunities does the Forex Day Trader have on a given day? A sensitivity analysis would show that we have 6 Big Currency Pairs (EURUSD, GBPUSD, USDCHF, USDJPY, USDCAD, AUDUSD).

At least 2 commonly traded crosses (EURGBP, and EURJPY). This provides 8 currency pairs to provide opportunities for the Day trade. When each currency pair's chart intervals are examined carefully for an evolving trading signal, we have geometrically increased the potential for trades. A Day trade in Forex can often provide more opportunities to trade than available capital in an average account. The trader need not rush to trade, but choose among competing opportunities.

A good rule of thumb for the beginner Day Trader to spot trading opportunities is to use the 4 hour time interval. It represents a decent amount of time for prices to evolve wider ranges that are tradable. During a 4 hour period, currency pairs often exhibit ranges that provide the enough PIP distance between Resistance and Support. to achieve Day trading goals.


So if we estimate that we can expect 2 opportunities per currency pair during any given 4 hour period, we can expect 16 trading opportunities that can justify putting on a trade. If we take extreme rationing of these opportunities and select only 1 trade per 4 hour period per currency pair, we have more than enough to allow a person to take Forex Day trading as a serious opportunity. A common occurrence is a cluster effect where the action in one currency pair cascades across all of them and, suddenly, almost at the same time, there are numerous opportunities! The distribution of trading opportunities, however, is not random, and patience in waiting for the right opportunity is a worthy skill to acquire.


Pulling the Trigger

Putting on the trade, after all, is what the analysis leads to, but it is not a spontaneous event. While there is no single rule of action on what a price trigger is, we can narrow conditions to be such that the trade is reasonable and can be supported by a combination of technical factors. For example, in the chart below, the price is probing the lower channel line and a trade going long would coincide with a confirmation that the position is oversold. Notice that in the example below, Relative Strength Indicator is breaking its own trend line. This is a very useful confirming tool when oscillators are used in technical analysis.


During any given day in Forex Trading, patterns emerge inviting a trade. The skilled trader waits for a high probability trade where confidence is high that the trade will work. Contributing to confidence may very well be the trader's own psychological mind set and optimism. Ultimately, the Profit and Loss Chart will demonstrate whether one is engaged in wishful thinking or a winning game. Whether one looks for a quick grab of profits that will pay for a dinner date, or for a trade that makes the month's mortgage payment, Day trading Forex has embedded in its market patterns, the potential for achieving a variety of trading goals. Forex Day trading offers a range of opportunities but there is an entrance requirement- The Forex trader who wants to be successful needs to come armed with a box of tools, and a set of rules.

by Abe Cofnas

Bunny Girl (BGX) System

Bunny Girl Siytem use is the famous one in forex online trader, her system has been used by many trader in forex online trader. This is her setup;

Chart Setup
· 30 minute, candlestick
· WMA 5
· WMA 20
· WMA 100
· RSI 14

Go Long
· WMA5 Crosses above WMA20
· WMA5 and WMA20 above WMA100
· RSI signals divergence or is above 50

Go Short
· WMA5 Crosses below WMA20
· WMA5 and WMA20 below WMA100
· RSI signals divergence or is below 50

Filters
· Use a filter to eliminate frequent stops and catch the trend at the right time
· EURUSD: 25 points plus the bid/ask spread
· Other recommended pairs: 30 points plus the bid/ask spread
· These filters can and do change
· Cancel the trade if the filter price has not been reached before 5 minutes remaining on
the 30 minute bar.
· Filters on other pairs can be determined (see "Advanced Topics")

Orders
· If bull cross, place a buy stop order at the filter+spread.
· If a bear cross, place a sell stop order at the filter+spread.
· When the filter price is reached and the order engaged, place a stop loss at about the original crossing. (Can goas much as pips away on the other side of the crossing.)


Stop Loss
· 5 pips beyond the cross (or bounce) price

Trading Around Daily Open
Daily Open = open price at 00:00 GMT. Make sure there is room enough for profit targets between filter (entry) price and daily open. If the cross is on one side of the daily open and the filter is on the other, than this is OK to trade. Additionally, the best signal to receive is when multiple pairs are crossing at the same time.

It's simple but poweful. Try this !

Friday, January 12, 2007

Profitable Sidus Method

I started to adapt the systems with my onw rules. The biggest advantage of the Sidus method is that it is not necessary for adding extra filters. Whipsaws will occor, but less frequent. This system made my trading very profitable as it easy to understand, easy to implement and easy tofind the right entry-points.

Profitable Sidus Method


What do you need?
- 1H (of 30MIN, but you wil get wore whipsaws) candlesticks/bar charts
- 18 EMA & 28 EMA (put them in red)
- 5 WMA (in blue) & 8 WMA (in yellow)

The 18 EMA & 28 EMA are two red lines who form a tunnel, these will help you to determine the startof a trend and the end of a trend (Long term).
The WMA & 8 WMA will show you when to enter a trend, they will also help you to see the strenght of the trends (Short term)

Entry Signals
You should only open a position, when the red tunnel is extremly narrow or crossed !
LONG: 5 WMA & 8 WMA cross the red tunnel upwards. If the 5 WMA also crosses the 8 WMA upwards, then the signal is extra strong.
SHORT: 5 WMA & 8 WMA cross the red tunnel downwards.If the 5 WMA also crosses the 8 WMA downwards, then the signal is extra strong.

Exit Signals
Signals that show the end of the chosen trend:
- Long: The price has reached a top and 5 WMA dives under 8 WMA (Close position)
- Short: The price has reached a bottom and 5 WMA jumps above 8 WMA (Close position)

Always close your position when boundry’s of the red tunnel cross eachother or when they become so narrow that they are one! This is a clear sign of a trend reversal. After you see this, close your position and open a new postion in the other way (If you were long, close, open a short postion)

When in a trade and the 5 WMA & 8 WMA cross the red tunnel -> Pay attention! As long as the redtunnel boundy’s doesn’t cross eachother there is no problem, but often this is a sign that they will!

Basic rule
Enter a position were the red tunnel boundry’s cross and exit that position when they cross again!!! Always use a stoploss - I recommend a 10-15 pip stoploss !!!

I want to thank Vegas, Bunnygirl and all the nice people of ForexFactory for their great inspiration.

By : Sidus

Swing Trading with Fibo

This system is inspired by a guy called Vegas so i must give credit where it is due but also he outlined this as a model and also said that he does not "mind" that the system i am about to describe is let out in the open. Becuase this is a model its not a complete system but with your help i think there is room for improvement to what already is so far as i can tell a profitable system.

The orignal concept used 1 Hour bars using different SMA but for ease of use and increased profit ratio some of us looked at the 4 hour model to which i will describe here. The benift of 4 hours is you get a good nights sleep, can go out during the day for many hours and so basically are not tied to the PC all day. 4h also provides a balanced blend between the short term intraday 15m 20m 1h time and longer daily and weekly cycles so we are still capturing a good portion of the market swings.

Its uses a 55 SMA as its core. This is not a random picked number its a fibo number sequence and has been found to follow on almost any time frame the general movement of the market.

Overlayed on the same chart are fibo number sequence lines where we take profit. In case you didnt know for newbies reading this the sequence is 1, 2, 3, 5, 8, 13, 21, 34, 55, 89, 144, 233, 377, 610, and higher.
However it has been noted that in the case of euro it will only deviate from the 55 SMA out 233 pips away before it has to retrace. There are some rare spillage exceptions but this is a rule of thumb. Other pairs like cable and some volatile crosses will go to 377 pips away from the 55 SMA and retrace. So the basis of the system is we buy as soon a we are above the 55 SMA and Sell below it.

Now this is the clever part that makes nearly ALL moving average systems fail. Fibo numbers are well known retracement points and they are also excellent supp resistance areas so by taking a partial profit at 89, 144 and 233 use on euro we capture the main places a price is most likley to reach before it returns back to the 55 SMA line.

For pound and others the 3 fibo numbers used are 144, 233 and 377. OK so you might ask well how do i know what set to use on each pair? Easy plot these lines based on the 55 SMA then SHIFT and draw these fibo lines 144 pips 233 pips and 233 pips higher and lower off the SMA so the chart looks like wavy rail tracks both above and below the 55 SMA then look to see for a particular pair it will fit like a glove 98% of the time to the furthest price you can see on the charts over many months.

The age old problem is should we use filters to make sure the price goes over the 55 SMA to take a long or visa versa for a short. Vegas suggest that a 12 EMA is overlayed which needs to cross over the 55 SMA to take a long posi. I found 13 (fibo) JMA Jurik much better then EMA. If you dont know what Jurik JMA is then google it. I seen a thousand other filters can be used BUT anything you use will result is a delay and can miss major moves. It matters not if you CCI, EMA, mommetum RSI etc etc it will result in some moves being completly lost.

Just recently on MT they have a Moving Average Expert to play with as standard on new MT 4. That system just appears to wait for a complete bar close above or below the 55 sma and thats your signal. I was amazed how well this works. it needs no stops, no filters nothing. If it closes above we go long, a close below we go short.


Now we left the tunnel going long with say 4 lots. A the 1st fibo i take 1 lot profit at 89 fib, another lot at 144 fib and another lot at 233 fib. Because the price wont go futher then this 98% of the time we have locked in the entire range but the last lot is left open. This is becuase if the last lot is left open if we return to the 55 SMA its so small it wont really harm our profit but there is a chance the 55 SMA can begin to slope up at a steep angle and the price and the 55 SMA will run for hundreds of pips. So the last lot left open begins a free trade. This is the opposite of most conceptions where you think you should be adding to trades but we are reducing our risk by taking profits in fibo stages. In practice this is MUCH safer.

OK you hopefully have the basis of this system. Its a swing trader with partial profits but instead of saying TP at "normal" 30 50 or 100 pips we are using something of real mathmatiical substance of where the market is likely to stall at ie fibo points.

In practice a risk map needs to be defined the 55 SMA does get whipped. Most of the danger is in the crossing becuase we are fully loaded. An expert script on mt4 is really needed to find the initial risk value of the system eg i have 100k to start risk %= 30% will this blow the account??

Next most important i described taking 1 lot at each fibo but ideally this should be a % of the initial order eg 30% This is so we can scale in any size of account and compound growth.

So 100k cap start with 30% = 30k or 30 lots
fibo % is set to 30% TP so
30 lots - 30% = 9 lots TP on 1st fibo = 21 left
second fibo hit now 21 - 30% = 6.3 so round this to 6 leaves 15 lots
Third fibo hit 15 lots left - 30% = 4.5 round up to 5 = 10 lots.

These last lots are left runnning incase we trend hard but its likely also to return back to the 55 SMA but we havent gone back empty handed as profits have been taken yet we have left some open in case we catch a nice trend which happens about 10 times a year.

What i need to know is the optimal % of the TP order value that should be used. If any one can script this on MT4 the backtester has an automatic optimiser to find the max profit of any user varaible. My manual testing has shown that 30% may be fine and certainly a starting point.

Also one can see the greatist portion of the order is taken at the 1st fib. This is because the market ranges more at the 89 fib then it does trending so we lock in the greatest protion of the profit early rather then later. Incidently profit is only taken at each fib level once. If the market ranges between the 1st and 3rd fib level we only take profit only once the first time it was hit. Only a break across the 55 SMA clean on bar close reverses the trades and opens a fresh full lots order based on the initial capital % risk value.
by Bolt1

Wednesday, January 10, 2007

Stryker Non Farm Payroll Strategy

Three things you can do when trading NFP (along with other data's associated with it)
  1. Don't trade at all that day
  2. If you have a live trade on for some certain time and its giving you at least above 80 pips in gains... place a breakeven s/l and let it run...worst come to worst it'll be a breakeven, otherwise you can easily add 150-200 pips to it, or even better you can hold the pair for longer term, as the real directional move after heavy consolidation (which is mostly seems to be the case prior to the NFP data). So now you can be sitting in the trend and enjoying awesomely
  3. This is what I do. Since NFP is the not the only data on board (there are others as well), so they could be mixed out (good and bad), and hence the scenario could be ugly.
So we have the good, the bad and eventually the ugly side of it as well. Add Federal Reserve Speech and you have perfect recipe for a disaster. Now watch the charts for some NFP data, as soon as it comes out… the first move that u c on the 5 mins graphs is usually the fake one. The real story kicks in the nxt 5 mins charts…. If the high of previous 5 mins is not taken out in the 2nd 5 mins graph, it usually means the top has been formed… I sell with my s/l above the high of previous 5 mins graphs. And my limit usually runs for 140-180 pips from there… risk/reward is beautiful…

However safer is still to watch the whole first 15 mins candle and then sell if the high doesn’t seems to be taken out… you probably won’t get a much better price, but still a good trade can be formed out. Vice versa if it’s shooting down initially.

A plus point being Federal Reserve Speech, where he needed to back bush upbeat comments about the dollar and the twin deficit and you can form a clue where it’ll eventually head…

The loss factor is still there. But if you compare R/R it’s worth a try to me…. And I do that almost every time. Sure I learned through bitter experience not to trade NFP, but this to me is much safer… and if it clicks, I just end up taking positions on other pairs as well w/o any prejudice. Of course when I’m in a very comfortable position in my original first pair and after a break of any major support/resistance on other pairs…. will i take positions.... at times ranging from 20-70+pips.....

EDIT: when watching the 5 minutes or the 15 minutes candles, keep in mind the close of the first initial candle needs to be way off from the high...... since its NFP and we are considering 5 minutes candles we cannot have a close to low below..... rememebr we are talking about NFP....
eg..... high on first 5 mins candle of euro was around 3040, the close was at 3027, however i think it dipped till 3015 on the first 5 mins on the first initial 5 min candles.... so a good sense that there is quite heavy selling interest that lies there.....
now the close was at around 3027.....on the first 5 mins candle. since i was out and didnot trade, i would have waited to short from around 3030/35 with s/l above 3058, since i was having first resistance showing at 3054...... my limits would have been initially around 2850/80 region.. s/l could still be 1 pip above the high of the first 5 mins candle....... but to my mental satisfaction, it would have been above 3054 resistance.