
Talking Points:
- EMA’s are weighted averages used in trending markets.
- Find the trend with a 200 period EMA.
- Time entries using a series of EMA’s utilizing smaller periods.
Today’s strategy will revolve around the use of a series of EMA’s (Exponential Moving Average). These averages work the same as a traditional SMA (Simple Moving Average) by directly displaying an average of price for a selected period on the graph. However, the EMAs calculation incorporates a weight to put a greater emphasis on most recent price. This weight is placed to remove some of the lag found with a traditional SMA. This makes the EMA a perfect candidate for trend trading.
Now that you are familiarized with EMA’s let’s look at their uses in a trend trading plan.
Find the Trend
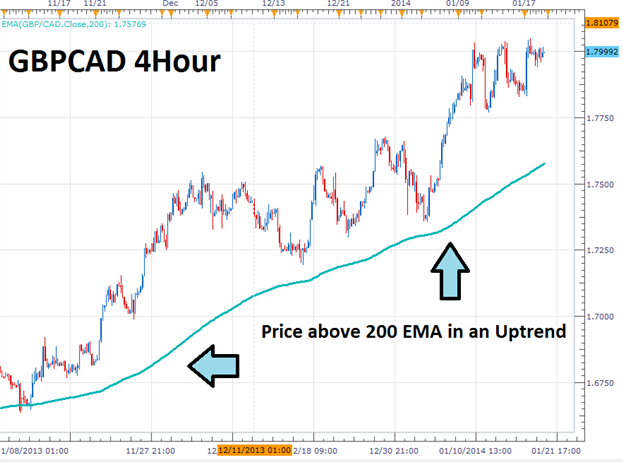
Before we enter into a trend based position, we need to know exactly which way that trend is heading. Below we have the GBPCAD on a 4Hour Chart. We can see the pair is making new highs while establishing higher lows, which makes the GBPCAD a strong candidate for an uptrend. This analysis can be confirmed by the use of a 200 EMA. Traditionally traders are bullish when price is above the 200 EMA and bearish if price resides under the average.
Given the information above, traders should look to buy the GBPCAD.
Learn Forex – GBPCAD 4Hour Trend & 200EMA
Once market direction is identified, we can then use a series of EMA’s to enter the market. Below we can see that a 12 and 26 period EMA have been added to the graph. Since we are only looking to buy in an uptrend, it is important to identify areas where momentum is turning back in the direction of the trend. EMA’s can help us decipher this by identifying an area where our shorter period moving average crosses above the longer period EMA. At this point traders can look to buy the market.
Below you will find several sample buy entries using EMA’s on the GBPCAD. Remember, this process can be replicated for a downtrend by selling in the event that the 12 period EMA crosses below the 26.
Learn Forex – GBPCAD 4Hour Entries

Exiting Positions
Now that a trade has been opened, traders need to identify when it is time to exit the market. This is the third and final step in developing a successful strategy! Traders may choose a variety of stop/limit and risk reward combinations here to suit their trading needs. However, if you are already using a series of EMA’s they can be incorporated into your market exit. If we are buying on a return to bullish momentum, traders should close positions when momentum subsides. This can be found in an uptrend when price moves back and touches the 12 period EMA.
Stops should also be placed when trading with the trend. One simple methodology is to place stops under a swing high or low on the graph. This way in the event that the trend turns, any positions can be exited for a loss as quickly as possible. The graphic below will show an example of both scenarios.

Source: Walker England, Trading Instructor
No comments:
Post a Comment