Showing posts with label 4 Hour Strategy. Show all posts

Thursday, August 21, 2014

3 Step EMA Forex Strategy

The EMA lines are a very useful simple indicator to determine the direction of price movements, whether the trend is taking place or being ranging. When it comes to trending markets, traders have many options in regards to strategy. In this article we will see how to use EMA’s and how they can be used to create a complete strategy for Forex trends.

Talking Points:
  • EMA’s are weighted averages used in trending markets.
  • Find the trend with a 200 period EMA.
  • Time entries using a series of EMA’s utilizing smaller periods.
The EMA

Today’s strategy will revolve around the use of a series of EMA’s (Exponential Moving Average). These averages work the same as a traditional SMA (Simple Moving Average) by directly displaying an average of price for a selected period on the graph. However, the EMAs calculation incorporates a weight to put a greater emphasis on most recent price. This weight is placed to remove some of the lag found with a traditional SMA. This makes the EMA a perfect candidate for trend trading.

Now that you are familiarized with EMA’s let’s look at their uses in a trend trading plan.

Find the Trend

Before we enter into a trend based position, we need to know exactly which way that trend is heading. Below we have the GBPCAD on a 4Hour Chart. We can see the pair is making new highs while establishing higher lows, which makes the GBPCAD a strong candidate for an uptrend. This analysis can be confirmed by the use of a 200 EMA. Traditionally traders are bullish when price is above the 200 EMA and bearish if price resides under the average.

Given the information above, traders should look to buy the GBPCAD.

Learn Forex – GBPCAD 4Hour Trend & 200EMA


Timing Market Entries

Once market direction is identified, we can then use a series of EMA’s to enter the market. Below we can see that a 12 and 26 period EMA have been added to the graph. Since we are only looking to buy in an uptrend, it is important to identify areas where momentum is turning back in the direction of the trend. EMA’s can help us decipher this by identifying an area where our shorter period moving average crosses above the longer period EMA. At this point traders can look to buy the market.

Below you will find several sample buy entries using EMA’s on the GBPCAD. Remember, this process can be replicated for a downtrend by selling in the event that the 12 period EMA crosses below the 26.

Learn Forex – GBPCAD 4Hour Entries


Exiting Positions

Now that a trade has been opened, traders need to identify when it is time to exit the market. This is the third and final step in developing a successful strategy! Traders may choose a variety of stop/limit and risk reward combinations here to suit their trading needs. However, if you are already using a series of EMA’s they can be incorporated into your market exit. If we are buying on a return to bullish momentum, traders should close positions when momentum subsides. This can be found in an uptrend when price moves back and touches the 12 period EMA.

Stops should also be placed when trading with the trend. One simple methodology is to place stops under a swing high or low on the graph. This way in the event that the trend turns, any positions can be exited for a loss as quickly as possible. The graphic below will show an example of both scenarios.


Source: Walker England, Trading Instructor

Wednesday, August 20, 2014

The Bladerunner Forex Strategy

The Bladerunner forex strategy is a price action trading so it using tools like candlesticks, pivot points, round numbers and support and resistance levels when trading this strategy. But you can add more indicators if you think that they're useful or you feel more comfortable having some extra confirmation.

In this article we use the 20 EMA for confirmation indicator. Another alternative is to use the midline of the standard 20 Bollinger bands. Either works well, in fact you can use both to trade it as a Bollinger band EMA strategy.

The Bladerunner forex strategyp can be traded on any pair. It can also be traded on any time frame, but the examples below are from 5 min charts.

It can be traded at almost any time of the day, but obviously some times are more reliable than others. For example, the early part of the Asian session may provide a decent break out and retest giving an entry, whereas the Asian afternoon session can be very slow. Then, when London opens the price may be too erratic and volatile to give any reasonable entries for any strategy.

Later again, after the initial flurry of news announcements has passed and price has settled, you may once more get a reliable entry or two. You will therefore have to adjust this strategy to the times when you are able to trade it.

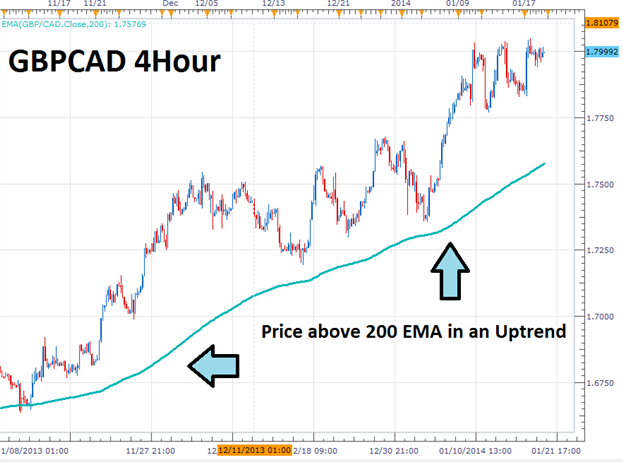
The strategy is named Bladerunner because the 20 EMA acts like a knife edge dividing price. If price is above the EMA, and respecting it, and retests the EMA, it will likely reject to the long side. And if price is below the EMA, and respecting it, and retests the EMA, it will likely reject to the short side. A few examples might help to clarify:


If price is below the 20 EMA, our bias is short and we would be looking for price to move up and hit the 20 EMA, reject and then move down.

However, if price pierces the 20 EMA and closes convincingly above it, we deem price to have switched polarity and now our bias changes to long. (This can be seen occurring at the right of the above picture). From now on we would be looking for price to move down and hit the 20 EMA, reject and then move up.

An example of one definite and one possible losing trade:


Essential entry parameters for this setup are:

  • Price must break out of consolidation or a range prior to entry, i.e. it must be trending
  • Price must then retest the 20 EMA successfully


What constitutes a successful retest?

If price is above the EMA it must bounce from and stay above the EMA; and vice versa for when price is below the EMA. More specifically: The first candle that touches the EMA should close on the same side of the EMA as it approached it from.

This then becomes the signal candle. Price has now rejected from the EMA and we are looking to see if the next candle confirms the move. If the next candle continues the move away from the EMA then this candle becomes the confirmatory candle. This is a simple way to trade the strategy; if you want to play it safer you could insist on a recognisable forex candlestick pattern occurring to confirm the trade.

n.b. if the Bladerunner seems simplistic, it is because forex price action and current fundamentals are factored into trading decisions. No entry is ever taken based purely on price having rejected from the 20 EMA.

Impotant Notes:

  • Always look for a confluence of reasons to enter the trade. For example, it’s safer to have more than just a rejection from the 20 EMA. Ideally, you would like to see this happening at the same place as an old support/resistance level, pivot level or other significant price impact point.
  • Always be on the lookout for impending news announcements when trading this setup, especially on the lower time frame charts. I generally will not enter any trade within 30 to 45 mins before a scheduled news event, and will always wait at least 15 mins after the event before considering a trade.
  • Always trade with the direction of the current trend, as determined by which side of the EMA or polarity indicator price is currently on.


Order Placement:

(Note: the following parameters call for spreading your entry across two orders, but nowadays I have found that it is simpler for me to just enter one position/order per trade. However, many traders prefer to have their trade split across two positions, as this enables them more flexibility in their exits.)

A suggested approach is to open 2 orders when trading this strategy. The orders are as follows:

For a long entry:

  • 2 buy stop orders are placed with entry 2 pips above the confirmatory candle.
  • Orders expire at the start of a new candle. For example, if entering limit orders on the five-minute chart, those orders will expire at the start of the next five-minute candle, unless they have already been filled by price action on the current five-minute candle.
  • The stop loss is placed 2 pips below the signal candle that touched the 20 EMA. This particular rule is not set in stone, you may place the stop behind a recent swing point if you believe that would give a more realistic stop size.
  • The take profit for the first order is set at an amount equivalent to the risk in pips. For example, if the risk in the trade is 20 pips, the first order’s take profit target will be set at 20 pips.
  • The take profit for the second order is set at an amount equivalent to double the risk in pips. So, to use the above example, the take profit on the second order would be set at 40 pips.

For a short entry:


  • 2 sell stop orders are placed with entry 2 pips below the confirmatory candle.
  • Orders expire at the start of a new candle. For example, if entering limit orders on the five-minute chart, those orders will expire at the start of the next five-minute candle, unless they have already been filled by price action on the current five-minute candle.
  • The stop loss is placed 2 pips above the signal candle that touched the 20 EMA. This particular rule is not set in stone, I may place the stop behind a recent swing point if I believe that would give a more realistic stop size.
  • The take profit for the first order is set at an amount equivalent to the risk in pips. For example, if the risk in the trade is 20 pips, the first order’s take profit target will be set at 20 pips.
  • The take profit for the second order is set at an amount equivalent to double the risk in pips. So, to use the above example, the take profit on the second order would be set at 40 pips.


Trailing stop:

Once price has moved in favour of the trade by an amount equivalent to the initial risk, one of the orders is closed (due to its reaching take profit 1 level) and the stop loss on the remaining order is moved to breakeven. Using the above examples, once price moves 20 pips in favour of the trade, the first order is closed and the stop loss on the remaining order is set to breakeven.

This remaining order’s stop is then left at breakeven until the market closes the trade, either by reaching the profit target or by stopping out at breakeven. Again, this rule is not set in stone: there may be times when you may wish to continue trailing the stop beyond breakeven, for example, when a news announcement is imminent.


Tuesday, February 11, 2014

Tom's Simple 7 Strategy

Tom's Simple 7 forex strategy using EMA indicator setting 7 (close) as a determinant in taking open position. This scalping forex strategy work good on any time frame. It's a simple strategy but good enough to read the direction of price movement. Premises should be combined with higher timeframe. And you can add your indicators if you like.


How to setup the chart:

  • Set a 7 close price EMA.
  • Set a 50 close price EMA
How to Trade

If the 7 EMA is lower than the 50 EMA trade only the short opportunities for maximum risk/reward. So if the closed candles are below the 7 EMA trade short.

If the 7EMA is higher than the 50 EMA trade only the long opportunities for maximum risk/reward. So if the closed candles are above the 7 EMA trade long.


This is a trend-based strategy. The 50 EMA is there to indicate an increasing, decreasing or consolidation trend. I would not be interested in trading this strategy in a period of consolidation.

Warning:
These instructions expect that you have basic trading experience and is not meant to teach or train you in trading derivatives or forex. With that said, you can use this method on any timframe, but since we are differentiating the positions above and below the 7 EMA that means you will have to monitor your trade constantly after you enter it.

Note:
This method was left simple to allow people to use it as I basically set it forth, but also to allow you to adjust it to meet your needs and allow room for your new ideas based on it.

Tuesday, September 25, 2012

BBMA Forex Strategy

BBMA or Bolinger Band + Moving Average forex system is a pretty popular strategy these days. Many traders use this strategy and they find it’s quite helpful to predict the price movements. Mainly to predict the big trend and find where and to where prices will move.

This forex strategy can be used on any time frame but It’s recommended used on timeframe H4 and H1 to know the big trend anda use M15 for make entry decision. On pair EURUSD, GBPUSD or USDCHF.


Setup the Indicators on your chart 
  1. Add Bolinger Band Period 20, Deviation 2 
  2. Add Bolinger Band Period 20, Deviation 1 
  3. Add Moving Average Period 5, MA method : Linear Weighted, Color : RED, Apply to : High 
  4. Add Moving Average Period 5, MA method : Linear Weighted, Color : PURPLE, Apply to : Low 
  5. Add Moving Average Period 55, MA method : Expotinential, Color : Aqua, Apply to : Close 

How to trade 
  1. Determine the big trend by looking the Moving Average (MA 55) on timeframe H4 and H1, look if the candel prices is below candlestick or above. If they're below of MA 55 then we are going to find any chance to sell on TF M15. And vice versa if they're above of MA 55 then we're going to find any chance to buy on TF M15. 
  2. In time frame M15 the best signal for entry when the candlestick touch upper or lower bollingger band, Especially when you see good signs for candel reverse like doji or long shadow. 

It’s very recommended to use this forex strategy using your demo account until you familiar with it at least 3 months. After that you can go with your live account. Happy trading…!


Download BBMA indicator :  BBMA indicators and Template


Credit : dollarsmagic from mt5 forum

Wednesday, June 27, 2012

Swing Trading with Heiken Ashi and Stochastic System

This forex strategy deceptively simple but profitable basic on trend following system. It uses a few of indicators work good on 4 hour charts but other people are using other timeframes successfully.

Indicators you need;
  • Heiken Ashi candles 
  • SMA 100 Close 
  • Stochastic 8,3,3 low/high

Heiken Ashi candles are "average price" candles. They are calculated using a moving average and change colour according to that average. The open, high, low and close of these candles represent slightly different things to normal candles and the best way to get a feel for them is to put them on your chart and see how they look. If you have metatrader you can go to a line chart and then set line chart to "none" in the chart properties and that gets rid of the line leaving you a nice blank screen to put your HA candles on. Notice how the candles can sometimes stay one colour for a long period of time, hundreds of pips on a 4 hour chart. Catching and holding on to these long trends can be very profitable but of course it is not always as easy as all that!

The 100 sma is there to help visualise the trend. As a basic rule of thumb if the price is above the ma the trend is up and we only want to buy and below is down and we only want to sell.

The stochastics give us information about the strength of the pullback in the trend. I find stochastics to be the best momentum based oscillator to help visualise turns in the trend and they work very well with HA candles.

Basic Method 

In an uptrend you want to see a move up followed by a smooth decline in prices signified by green HA candles followed by red. When the HA candle turns back to green and the stochastics make a nice smooth cross towards the bottom of the stochs window then wait for the 4 hour candle to close and open your long trade. In a downtrend you want to see the opposite.

Money Management, Stops and Targets

There is some combination for the best stop loss and target combination to use to capture the most profit from these signals. There are 3 basic methods that I believe are worth testing.

  1. Enter the trade with a 50 pip stop loss. Hold the trade open until the HA candles turn back against the trend moving the stop loss behind the trade as it moves. 
  2. Enter the trade with a 50 pip stop loss and a 50 pip take profit moving the stop loss to +1 pip after +25 pips is reached. 
  3. Enter the trade with a 50 pip stop loss and take half profit at +25 pips moving the remainder to break even at that point and trailing the stop loss as the trade progresses. 


That's all, need more information of this forex strategy please visit FF forum

Sunday, April 22, 2012

Andrew Forex System

Andrew forex system using Supertrend and Nonlagdot as indicators.  They do not repaint and do not lag except for the current candle (bar), as well as any other indicator (including the moving average, Stochastic or RSI). This forex system is simple and effective without unnessary additional bugs and troubles. The market should be seen clearly to trade and give the predicted profit.

Rule: 
  • Currency pair: any, but better cross-pairs that give good trends. 
  • Time frame: any, but usually 4-hour 
  • Indicators: supertrend, nonlagdot (value: 20)
Entry rules 

Buy: A dot of Nonlagdot changes from red to blue. At the same time dots of nonlagdot should be above the Supertrend line. Also the Supertrend line should be green. A position should be opened by execution of a pending order. The order is placed on the upper point of the market extremum, which is formed after the first rebounce of the market downward (when closing price is lower than previous one). That is one should wait untill the price has exceeded the point of extremum, and only then buy. However, if the price fails to exceed the level of the point of extremum, one should wait. After the formation of a new point of the market extremum, the order should be shifted to that point. If the color of nonlagdot or supertrend changes to red, the order shoud be canceled.

Sell: A dot of Nonlagdot changes from blue to red. At the same time dots of nonlagdot should be under the Supertrend line. Also the Supertrend line should be red. A position should be opened by execution of a pending order. The order is placed on the lower point of the market extremum, which is formed after the first rebounce of the market upward (when closing price is higher than previous one). That is one should wait untill the price has exceeded the point of extremum, and only then sell. However, if the price fails to exceed the level of the point of extremum, one should wait. After the formation of a new point of the market extremum, the order should be shifted to that point. If the color of nonlagdot or supertrend changes to blue, the order shoud be canceled. Market entries without placing pending orders are not recommended. Pending orders for market entries are placed with the regard of the amount of the spread and additional 3 pips.

Exit rules 

Exit from trade when:
  1. The price touches the Supertrend line, or 
  2. The Supertrend line changes its color, or 
  3. The price touches the first line of the Fibonacci fan. The Fibonacci fan is constructed from the point of the market extremum at the beginning of its movement and up (or down) to the opposite extreme point of the current market, that is, from the bottom to the top of the movement (when buying) and from the top of the movement to the bottom (when selling). It is important not to confuse: the Fibonacci fan is constructed not from the market entry point, but from the point of the beginning of directional movement or trend (up or down). Fibonacci fan line, which is closest to the price, serves as the exit level. And the exit order should be moved on this line. 

Stop-loss is set:
  1. On Supertrend line, or 
  2. Below near price swing, or 
  3. Under (over) the closest extremum of the market, which exceeds the Supertrend line in the opposite direction. 

Stop-loss order is placed with the regard of the amount of the spread and additional 3 pips.

The following money management is recommended: either not more than 10% of the capital per trade, or a progressive system (e.g. Fibonacci or semi-martingale). Martingale is not recommended because it is far too risky in case of the lack of capital after several consecutive losing trades.

Adding is recommended solely to profitable positions after the regular change of Nonlagdot color in the direction of the current trend.


Andrew Forex System


Andrew Forex System

 Download template and Indicators HERE

Source and Credit to Forexfactory.com

Tuesday, July 27, 2010

Andrew Forex Trading System

This forex trading system was introduce on a forex forum by Andrew Forex . The interesting thing of this strategy was simple and effective to predict price movement. Using two mainly indicators; supertrend and Nonlagdot, or you could add another indicator if you like. Trading at any pair but better cross-pairs that give good trends. You can use it on anytime frame but recommended to use it on 4H time frame

Rules of  Andrew Forex Trading System

Buy Entry:
A dot of Nonlagdot changes from red to blue. At the same time dots of nonlagdot should be above the Supertrend line. Also the Supertrend line should be green. A position should be opened by execution of a pending order. The order is placed on the upper point of the market extremum, which is formed after the first rebounce of the market downward (when closing price is lower than previous one). That is one should wait untill the price has exceeded the point of extremum, and only then buy. However, if the price fails to exceed the level of the point of extremum, one should wait. After the formation of a new point of the market extremum, the order should be shifted to that point. If the color of nonlagdot or supertrend changes to red, the order shoud be canceled.

Andrew Forex  Trading System


Sell Entry:
A dot of Nonlagdot changes from blue to red. At the same time dots of nonlagdot should be under the Supertrend line. Also the Supertrend line should be red. A position should be opened by execution of a pending order. The order is placed on the lower point of the market extremum, which is formed after the first rebounce of the market upward (when closing price is higher than previous one). That is one should wait untill the price has exceeded the point of extremum, and only then sell. However, if the price fails to exceed the level of the point of extremum, one should wait. After the formation of a new point of the market extremum, the order should be shifted to that point. If the color of nonlagdot or supertrend changes to blue, the order shoud be canceled.

Andrew Forex  Trading System


Market entries without placing pending orders are not recommended. Pending orders for market entries are placed with the regard of the amount of the spread and additional 3 pips.


Exit position:
1. The price touches the Supertrend line, or
2. The Supertrend line changes its color, or
3. The price touches the first line of the Fibonacci fan. The Fibonacci fan is constructed from the point of the market extremum at the beginning of its movement and up (or down) to the opposite extreme point of the current market, that is, from the bottom to the top of the movement (when buying) and from the top of the movement to the bottom (when selling). It is important not to confuse: the Fibonacci fan is constructed not from the market entry point, but from the point of the beginning of directional movement or trend (up or down). Fibonacci fan line, which is closest to the price, serves as the exit level. And the exit order should be moved on this line.


Stop-loss is set:
1. On Supertrend line, or
2. Below near price swing, or
3. Under (over) the closest extremum of the market, which exceeds the Supertrend line in the opposite direction.

Stop-loss order is placed with the regard of the amount of the spread and additional 3 pips.

The following money management is recommended: either not more than 10% of the capital per trade, or a progressive system (e.g. Fibonacci or semi-martingale). Martingale is not recommended because it is far too risky in case of the lack of capital after several consecutive losing trades.

Adding is recommended solely to profitable positions after the regular change of Nonlagdot color in the direction of the current trend.

Attachment: Download Andrew Forex Indicators Here

Source: AndrewForex from www.fxstreet.com

Thursday, July 24, 2008

Braydensgrail System

Braydensgrail is a unique, method for trading on the Forex Market. It is not a scalping method. It is the result of many years of trial and error and research and common-sense investing strategies (i.e., online trading, participating in forum discussions and signal alert sites; and testing EA’s. The concept is aimed at profiting from the big 100-200 pip moves that occur in pairs.

The System:

1) Open any Forex chart, put the “Williams Percent Range” indicator just use the standard settings you don’t have to change anything. Next click and drag the “RSI” over the Williams Percent Range Indicator, using standard settings. Ok you’re done.
2) Next double-click “Accelerator Oscillator” once you have that on your chart click and drag the “Stochastic Oscillator” over it using standard settings.
Now, when the “Williams Percent Range” crosses below the “RSI” and the “Stochastic” and Accelerator Oscillators” cross below zero (0) at the same time, GO short! When the Williams Percent Range crosses over the “RSI” and the “Stochastic and Accelerator Oscillators” cross above zero at the same time, GO long!
Both these indicators work well on the H4 and Daily time frames. As an added option, I put a 50, 100, and 200 MA on my charts to both use a filter and trend direction.


Note: The red lines are were the indicators/indicator crossed and trades were taken. If you notice the Williams/RSI sometimes crosses first or the Stochastic/AC crosses first (you could use this as an early entry if you want to) these indicators are powerful enough to be used independently. I will sometimes enter the market early if I feel price action is going to cooperate, however I am more confident about a trade when all the indicators are reflecting one another. Other key factors the can influence my trading but not always are trend direction and fundamental reports such as news.

Money Management: As a "general rule"; I never risk more than 1% of total equity on any trade. I use a mental stop loss of -73 pips (depending on the pair and market conditions I sometimes increase it to -100 or more). If I have a trade open that is not yet in profit and I am going to bed or not going to be next to the computer for a few days I will place a stop loss with my broker. When a trade hits one pip profit I put a 15 or 25 point trailing stop on it (however if the market is acting volatile I will increase my trailing stop) and let it run until I am stopped out, but you can use which ever size trailing stop you want or your broker offers. Since everyone has a different account size I suggest you use a money management program that is best for your account. If you have more questions about money management visit: http://braydensgrail.wordpress.com/

2nd Note:Hi there folks, I won’t be posting any more signals on this thread (I never intended to make this thread a place to give signals) I just though I would post a few trades to let you all see how this system works, and because I received a few e-mails asking me to post, bank statements, credit card numbers, trading statements, etc.... ,so I though I would just post some trades instead, I hope that suffices. If you want to keep track of how my trading is going with this system go here: http://braydensgrail.wordpress.com/
Otherwise, I would like to move on to other ways that we can improve this system that I may have missed. Read, learn, and thanks for stopping by.

Download Braydensgrail System Template

by AgentFX at www.forexfactory.com

Tuesday, January 15, 2008

Pablosky Forex System

This forex system was posted by Pablosky at forexfactory.com forum. He said he has created and tested many systems and finally there is one it seems to generate regular profits for him. He only tested it on GBP/JPY and fund that H4 is the best timeframe to spot firm. He said that We have known that trends in GBP/JPY are strong and prolonged, but it's not easy to recognize its beginnings and the right time to exit. He was sure this system should work with other pairs with the right adjustments if needed, as each pair has its own personality.

Target points and Stop Losses for this system are “dynamic”, as he called them, because they change according to the indicators used. You will understand what he means once you read the logics. At first it may look a bit complex, but soon you will realize it's easy to follow and understand. Of course, charts with examples will finally give you the full picture.

This forex system uses visible indicators: ATR Channels and StepChoppyBars v1.1, which needs to work properly StepMA v7 and StepRSI v5.2 indicators.
StepChoppyBars is a great indicator created by Igorad from Forex-TSD.com forum. Legend for StepChoppyBars indicator is the following:

Blue :
Strong UpTrend.
DodgerBlue :
Retrace UpTrend
LightBlue :
Choppy UpTrend
Aqua : B
e ready to change UpTrend
Red :
Strong DownTrend
Tomato :
Retrace DownTrend
Orange :
Choppy DownTrend
Yellow :
Be ready to change DownTrend

Download Pablosky forex system MT4 indikators Here

Buy & Close-Buy Logics
Buy three equal positions when a candle closes between Lime ATR Centre Line and Aqua ATR Line, Step Choppy Bars candle is blue and previous Step Choppy Bar candle is Blue or Yellow. SL for the three opened positions is a candle closing below Yellow ATR line.

Target point for the first position is a candle closing above Aqua ATR line. Once this TP is reached, the Stop loss of the two remaining open positions will be moved to breakeven. TP for the second position is a candle closing above DodgerBlue ATR line. Once this TP is reached, the SL of the remaining open position will be a candle close below Aqua ATR line. If trend continues and price “touches” Blue ATR line, SL of this last position will be now a candle closing below DodgerBlue ATR line. This last position will remain opened till SL is triggered or a candle is painted Aqua.

Note: In the case a candle is painted Red, Tomato, Orange or Yellow during any time of the process, all positions should be closed.

Sell & Close-Sell Logics
Sell three equal positions when a candle closes between ATR Lime centre line and ATR Yellow line, Step Choppy Bars candle is red and previous Step Choppy Bar candle is Red or Aqua. Initial SL for the three opened positions is a candle closing above Aqua ATR line.
TP for the first position is a candle closing below Yellow ATR line. Once this TP is reached, the SL of the two remaining open positions will be moved to breakeven. TP for the second position is when a candle closing below Orange ATR line. Once this TP is reached, the SL of the remaining open position will be a candle closing above Yellow ATR line. If trend continues and price “touches” Red ATR line, SL of the last opened position will be now a candle closing above Orange ATR line. This last position will remain opened till SL is triggered or a candle is painted Yellow.

Note: In the case a candle is painted Blue, DodgerBlue, LightBlue or Aqua during any time of the process, all positions should be closed.

Note: If we see a sell opportunity but the candle is closing between Yellow and Orange lines (instead between Lime and Yellow lines), very close to yellow line, you may:
- Open three positions, apply the TPs and SLs for the 2nd and 3rd positions as usual and use the same TPs and SLs than the 2nd position for the 1st position.
- Open two positions, ignoring the 1st one and applying TPs and SLs for the 2nd and 3rd positions as usual. The same logic applies to a buy opportunity, but doesn't happen frequently.

When taking a position, always wait for the candle to close. A possible variation would be opening only one position and moving the SLs accordingly.

Pablosky said that, what he like about this system is that it generally gives accurate signals and if not, will tell you to exit early avoiding big losses. Also, it's very likely that for not so prolonged trends at least the first TP will be reached, so you will generally exit happy with profits. The system requires attention but not so much, it's enough to take a look at the chart every 4 hours to see how the candle is closing.

Example:


Buy


Sell

Wednesday, October 31, 2007

Fibonacci Forex Trading Signal

The fact that Fibonacci numbers have found their way to Forex trading is hard to deny. Moreover, trading currencies with Fibonacci tool for many traders have become the bread and butter of their whole trading career. So, shall we look at the one of such good Forex trading systems today?

Trading setup and tools we need:
Time frame: 3 hour (or 4 hour).
Currency pairs: any.
Indicators:
Fibonacci tool - our main tool
EMA 100 – green (visual guidance)
SMA 150 – red (visual guidance)
RSI (14) on a daily chart

We will be working with next Fibonacci retracement levels: 0.382, 0.618, 0.250 and 0.750.
Default stop loss – roughly 100 pips and then adjusted according to the most recent swing high/low.
Profit target – no target is set as we will let the profits run.
Trading Rules:
Find the closest to the current price wave with a distance from High to Low over 100 pips.
Apply Fibonacci on it no matter if the wave is going up or down, only size matters.
Some terms we are going to use here:
The corridor between 0.382 Fibonacci retracement level and 0.618 retracement on the chart – will be called a “must channel”.
Fibonacci retracement levels will be numbered always from bottom to top, no matter whether it is an up or a down wave. E.g. at the bottom we will always have 0.250, then next 0.382, 0.618 and finally on top – 0.750 Fibonacci retracement level.
Entry rules:
Always enter only according with both:
1. EMA and SMA trend suggestion (e.g. green on top – uptrend, red on top - downtrend)
2. RSI suggestion (e.g. reading below 50 – only sell orders, above – only buy orders).

Now, after applying Fibonacci on a wave bigger than 100 pips we wait for the price to go inside a “must channel” area (at least to make 1 pip into the channel). Only then next rules will be valid:
- If a full candle (including shadows) is closed below 0.250 Fibonacci retracement, we go short. If we are currently long – it is time to close long position – it is an exit rule as well.
- If a full candle (including shadows) is closed above 0.750 Fibonacci retracement, we go long. If till this time we had short positions open – we close them – and again it is an exit rule as well.

Important: once another wave greater than 100 pips occur, set a new Fibonacci on the new wave. Retracement levels will change and so we will now follow new retracements.
(Optional: for visual aid traders may mark old Fibonacci wave to see the general pattern of consecutive waves on the chart).


click image to enlarge

That’s it. Stay in trade, resetting Fibonacci with each new wave and moving a stop loss according to the last swings high or low (in simple words, a stop loss will be always just below the Fibonacci 0% line) until it is time to close the position according to our rules.


This strategy prevents a lot of “bad” entries, eliminates early exits and allows staying in trade for a long period of time helping to take everything a current move can offer.
Traders may close all good winning positions on Friday evening if they prefer not to hold them over a weekend.

By: Edward Revy
www.forex-strategies-revealed.com

Monday, September 24, 2007

25 and 50 EMA Forex System

This is a basic 25 and 50 EMA forex system setup;
4 Hour Chart
EMA 25 (Green)
EMA 50 (Blue)
Relative Strenght Index -RSI (14)
Stochastic (5,3,3)
Average True Range (100)


FOREX ENTRY CRITERIA

Take LONG position when
1. A candlestick open/close above the 50 EMA line
2. RSI is at or above 50 center line


Take SHORT position when
1. A candlestick open/close below the 50 EMA
2. RSI is at or below 50 center line


STOP LOSSES AND MANAGEMENT

Stop losses in this forex system are relatively easy to set. From the point of entry add 1 x’s or 2 x’s the current ATR value.

Trade management is extremely important with this forex system. The initial profit taking target is between 50 and 100 pips. Regardless of what position you have open. Recommended is to close 50% of your profits at your first target and immediately move your SL to B/E.

This can sometimes lead to your position being closed out when the price retraces, leaving you out of trade and possibly missing a greater profit, but it is the safer way to trade.

Another risk management option is minimizing your SL by 50% once you hit your initial target of 50 – 100 pips.

The remainder of the position is left to trail for profits. It is closed out either at historical S/R or at the cross/touching off Stochastic on the 4 Hour Chart. We do not trade on any time frame smaller than the 4 Hour Chart.

I recommend you move your SL from B/E to newly created S/R every time the price moves in your direction so you can better trail it. Of course you may also use an automated trailing order.

The important thing is to take profit at 50-100 pips after your entry on the candlestick open. Fake outs do occur, but when we take profit at 50 – 100 and move to B/E we are safe even at full price reverse.

This is an H4 System, trades will occur very often, You can expect 100 to +1000 pips.

Recommended to trade GBP JPY or EURJPY due to their volatility and NZDUSD because it trends steadily.


EXIT OPTIMIZATION

In many instances you will be forced to sacrifice more pips for the safer approach to forex trading. I’ve implemented the use of the Stochastic indicator when trading 25-50 EMA System so you can pinpoint an area on the chart which will leave you exiting your remaining position at a level you normally wount be able to capitalize on due to risk management.

Every time the Stochastic indicator begins touching or crossing you should consider exiting as the price may be pulling back. Naturally with this also occurs the occasion in which the price pulls back but does not close under the 50 EMA, leaving you out of a trade and probably having you wish you never exited in the first place. To capitalize on the bounce an minimize loosing to many pips we take advantage of the 25 EMA.

When price corrects, it will normally test the 50 EMA, if it does not break you will be looking to reenter, however an immediate reentry or an entry off a close/open after the bounce from 50 may often be false. In order to reduce this, we wait for price to close above 25 EMA before attempting another Long in the same direction of our previous trade. I recommend having a crossing or a touching of the Stochastic Indicator complement the open/close above 25 EMA when considering a reentry. Yes.. pips will be missed, but it is the least dangerous approach to the problem.

On the next picture you will see (in order of appearance) an entry, a first exit optimization area, a trade reentry based on 25 EMA and another Ex. Op. area.


The idea here is to move you SL to a LOW every time the price breaks a High (BULLISH) and vice versa: move your SL to a HIGH every the price breaks a low (BEARISH). Use Exit Optimizing when necessary.


Regards,
E. Lang
www.forexfactory.com

Monday, August 6, 2007

4 Hour Simple System

This is a simple one that I have found from forexfactory forum, it seem good system to try

Setting :

Simple Moving Average (SMA) 100
Damiani Volatmeter 10,60,1.4 (download Damiani volatmeter here)
MACD - 15,26,9
4 hour chart
Pairs EURCHF (it has a medium level volatility and it does not get trapped between news, though it reacts mildly but it could be worth checking the other pairs)


System Rules

Long:
Take a long trade when price closes above 100 SMA and MACD histogram goes above 0 line.

Short:
Take a short trade when price closes below the 100 SMA and MACD goes below 0 line.

Re-entry:
When the price, once has given a long or short signal, retraces back to the 100 SMA, re-enter the direction you went the first time. It is recommended to do it the first 2 times the price hits the 100 SMA and keep a watch thereafter.

Retrace entry:
When a bar is over 100 pips, wait for a retracement to occur towards the 100 SMA line and then enter. This will save you from unnecessary draw down.

Exit rule

Scaling:
Take 3 positions per trade. Set first TP to 40, 2nd TP to 70 and let the third position run with Stoploss at breakeven.

Stop loss:
1. Previous high/ low or what you call as support and resistance.
2. AutoPivot Indicator. Use only the weekly option in it and place stop accordingly.

Filter

This is a trend following system, and has it's bad days. To avoid getting trapped in a range, use the Volatmeter indicator. It is, so far the best indicator to helps detect a ranging a trending market. In volatmeter indicator watch when the white line crosses above the green, It mean the market beginning a range or already entered into it. When the green line crosses above the white line, market getting into a trend, this is what we looking for to take short position or long position.

As an example; once trade hits the first target, moved the second position to breakeven and leave the third as it is. When the 2nd position is hit, move the 3rd to breakeven, giving the trade enough room to breathe. Then look for the price to come back, to add to the position, if it is open. At times, when price comes back to the 100 SMA, get stopped out at breakeven, it has given 100 pips on 2 positions.

Another example

The blue box is the main entry and the yellow, you can see, is the re-entry.


By Marketsnipers from www.forexfactory.com

Thursday, June 21, 2007

Nobrainers Forex Strategy

Nobrainer forex trading strategy has proposed by someone who called Vynner in forex trading communiy forum www.forexfactory.com, it seems that this strategy attracted a lot of trader on that community. Because this strategy was easy and simple to use. Vynner said he has use this simple forex strategy from June 2006 and gave him 300 -400 pips a months.

Here is the system :

Things you need:
1) Daily Chart on GBP/USD
2) 4 hours Chart on GBP/USD
3) Slow Stochatics (13,5,5) on both charts
4) EMA 4, EMA13, EMA50 on the 4 hours chart

Look at 4 hours chart
Entry:
When the EMA4 first cross the EMA50 follow by EMA13 cross the EMA50, with a new open candle, place your entry with a stop loss of 50pips.
Exit :
When EMA4 reverse and cross the EMA13 on the next open candle.

They call this the NoBrainersTrade but Vynner has modified a few things and add in a really good filter base on the daily charts with slow stochastics.

For Filter look at Daily chart
Valid Long Entry:
Slow %K above Slow %D on the Daily Chart
Valid Short Entry:
Slow %D above Slow %K on the Daily Chart

"Very simple method but yet powerful. It works on other pairs too but I found this work best on GBP/USD" ---VyNNer----


Monday, January 15, 2007

The Tlatomi Method

In nahuatl (aztec language), tlatomi means ''to win money''

SETUP
1 - 4 Hour chart (This system works best with GBP/USD, GBP/JPY)
2 - NonLagMa_v4
● Filter=20
● Color=1
● ColorBarBack=0

SHI_SilverTrendSig
● Allbars=0
● Otstup=30
● Per=9.0
● Don't forget to change the colors also (0=blue-1=red)

FX Sniper's Ergodic_CCI_Trigger
● pq=4
● pr=8
● ps=5
● trigger=4

Entry
Enter long when :
1 – a blue dot appears
2 – the ergodic CCI crosses up the trigger line ( blue line crosses up the red one )
3 – NonLagMa color changes to yellow
Enter short when :
1 – a red dot appears
2 – the ergodic CCI crosses down the trigger line ( red line crosses down the blue one )
3 – NonLagMa color changes to yellow

Exit
Exit when a new dot appears (red if you are long and blue if you are short). This method gives you mecanicals trades. Don't hesitate to transform them into a discretionnay trade after because you can see things that the system can't. Sometimes, it will be the difference between a 30 pips trade and a 300 pips trade. Once you move your stop to breakeven and add a trailing stop – you can't wait alittle more time to see what the market wants to give you. Stop In general, I look for previous daily Resistance-Support but I don't have only one method for my stops. You can also looks for the high or low of the previous bar.

Remarks
Price enter :
The price enter is the open price of the candle or bars where the NonLagMa is yellow.

Ergodic_CCI :
The signal is stronger when the FX Sniper's Ergodic_CCI_Trigge is above 300 or under -300.

NonLagMa :
''The non-lag MA does turn yellow/non yellow while the current candle/bar is still forming ... so I wouldn't enter a trade until the end of the current candle confirms that the yellow section doesn't switch back to a non signal. So remember wait till the candle is fully formed until entering a potential trade!!!!''

To be more conservative means less profit but also more safety.
The order : I don't take a trade when the cross happens before the dot or when the cross happens after the nonlag. So, I wait for a dot then for the cross and then for the nonlag.
It doesn't matter if the cross and the nonlag happen at the same time but like i said earlier, the cross should never happen after the nonlag.

Swing Trading Strategy

This is a strategy that can be used on any timeframe, but personally, I prefer the hourly or 4 hours charts. The objective is to buy pullbacks during an uptrend and sell pullups during a downtrend.

1) Plot a 144 period moving average, triangular, exponential, weighted, adapted, whatever. Type of MA has no big importance, we use it to provide a price level only.
2) Plot pivot highs/lows
3) Plot a Laguerre RSI with default values (weighted close, .62) (not necessary, can be used as additional confirmation)

4) If price is above the MA we look to go long, if below, we look to go short
5) Draw a fib retracement (with 38.2, 50, 61.8 and 78.6%) level on the last significant swing
5) Wait for market to return back to the MA (important there should be at least 2 pivot highs during a pullback or 2 pivot lows during a pullup, see below)


6) Draw a tentative trendline through pivots highs/lows. This trendline should not be penetrated until price reaches the MA (otherwise you should cancel and replace)

7) Enter after a break of the trendline, after rebound on fibo/MA level (Laguerre RSI can be used for confirmation)
8) If long set the stop 1 pip below the most recent pivot low, if short set it 1 pip above the most recent pivot high (don't forget to include spread, if needed)

9) Immediately after taking the position, draw a new fibo retracement (38.2/50/61.8/78.6) on the last pullback/pullup

10) Trailing stop rules:
When price reaches 38.2%, set stop at breakeven
When price reaches 50%, set stop 1 pip below (if long) or above (if short) 38.2% level
When price reaches 61.8%, set stop 1 pip below (if long) or above (if short) 50% level
When price reaches 78.6%, set stop 1 pip below (if long) or above (if short) 61.8% level
When price reaches 100%, set stop below (if long) or above (if short) 78.6% level
If price breaks the 100% retracement, then set stop 1 pip above/below previous bar's high/low (note, if the 78.6% stop is closer, then don't move the stop)


Source By Mike

Friday, January 12, 2007

Swing Trading with Fibo

This system is inspired by a guy called Vegas so i must give credit where it is due but also he outlined this as a model and also said that he does not "mind" that the system i am about to describe is let out in the open. Becuase this is a model its not a complete system but with your help i think there is room for improvement to what already is so far as i can tell a profitable system.

The orignal concept used 1 Hour bars using different SMA but for ease of use and increased profit ratio some of us looked at the 4 hour model to which i will describe here. The benift of 4 hours is you get a good nights sleep, can go out during the day for many hours and so basically are not tied to the PC all day. 4h also provides a balanced blend between the short term intraday 15m 20m 1h time and longer daily and weekly cycles so we are still capturing a good portion of the market swings.

Its uses a 55 SMA as its core. This is not a random picked number its a fibo number sequence and has been found to follow on almost any time frame the general movement of the market.

Overlayed on the same chart are fibo number sequence lines where we take profit. In case you didnt know for newbies reading this the sequence is 1, 2, 3, 5, 8, 13, 21, 34, 55, 89, 144, 233, 377, 610, and higher.
However it has been noted that in the case of euro it will only deviate from the 55 SMA out 233 pips away before it has to retrace. There are some rare spillage exceptions but this is a rule of thumb. Other pairs like cable and some volatile crosses will go to 377 pips away from the 55 SMA and retrace. So the basis of the system is we buy as soon a we are above the 55 SMA and Sell below it.

Now this is the clever part that makes nearly ALL moving average systems fail. Fibo numbers are well known retracement points and they are also excellent supp resistance areas so by taking a partial profit at 89, 144 and 233 use on euro we capture the main places a price is most likley to reach before it returns back to the 55 SMA line.

For pound and others the 3 fibo numbers used are 144, 233 and 377. OK so you might ask well how do i know what set to use on each pair? Easy plot these lines based on the 55 SMA then SHIFT and draw these fibo lines 144 pips 233 pips and 233 pips higher and lower off the SMA so the chart looks like wavy rail tracks both above and below the 55 SMA then look to see for a particular pair it will fit like a glove 98% of the time to the furthest price you can see on the charts over many months.

The age old problem is should we use filters to make sure the price goes over the 55 SMA to take a long or visa versa for a short. Vegas suggest that a 12 EMA is overlayed which needs to cross over the 55 SMA to take a long posi. I found 13 (fibo) JMA Jurik much better then EMA. If you dont know what Jurik JMA is then google it. I seen a thousand other filters can be used BUT anything you use will result is a delay and can miss major moves. It matters not if you CCI, EMA, mommetum RSI etc etc it will result in some moves being completly lost.

Just recently on MT they have a Moving Average Expert to play with as standard on new MT 4. That system just appears to wait for a complete bar close above or below the 55 sma and thats your signal. I was amazed how well this works. it needs no stops, no filters nothing. If it closes above we go long, a close below we go short.


Now we left the tunnel going long with say 4 lots. A the 1st fibo i take 1 lot profit at 89 fib, another lot at 144 fib and another lot at 233 fib. Because the price wont go futher then this 98% of the time we have locked in the entire range but the last lot is left open. This is becuase if the last lot is left open if we return to the 55 SMA its so small it wont really harm our profit but there is a chance the 55 SMA can begin to slope up at a steep angle and the price and the 55 SMA will run for hundreds of pips. So the last lot left open begins a free trade. This is the opposite of most conceptions where you think you should be adding to trades but we are reducing our risk by taking profits in fibo stages. In practice this is MUCH safer.

OK you hopefully have the basis of this system. Its a swing trader with partial profits but instead of saying TP at "normal" 30 50 or 100 pips we are using something of real mathmatiical substance of where the market is likely to stall at ie fibo points.

In practice a risk map needs to be defined the 55 SMA does get whipped. Most of the danger is in the crossing becuase we are fully loaded. An expert script on mt4 is really needed to find the initial risk value of the system eg i have 100k to start risk %= 30% will this blow the account??

Next most important i described taking 1 lot at each fibo but ideally this should be a % of the initial order eg 30% This is so we can scale in any size of account and compound growth.

So 100k cap start with 30% = 30k or 30 lots
fibo % is set to 30% TP so
30 lots - 30% = 9 lots TP on 1st fibo = 21 left
second fibo hit now 21 - 30% = 6.3 so round this to 6 leaves 15 lots
Third fibo hit 15 lots left - 30% = 4.5 round up to 5 = 10 lots.

These last lots are left runnning incase we trend hard but its likely also to return back to the 55 SMA but we havent gone back empty handed as profits have been taken yet we have left some open in case we catch a nice trend which happens about 10 times a year.

What i need to know is the optimal % of the TP order value that should be used. If any one can script this on MT4 the backtester has an automatic optimiser to find the max profit of any user varaible. My manual testing has shown that 30% may be fine and certainly a starting point.

Also one can see the greatist portion of the order is taken at the 1st fib. This is because the market ranges more at the 89 fib then it does trending so we lock in the greatest protion of the profit early rather then later. Incidently profit is only taken at each fib level once. If the market ranges between the 1st and 3rd fib level we only take profit only once the first time it was hit. Only a break across the 55 SMA clean on bar close reverses the trades and opens a fresh full lots order based on the initial capital % risk value.
by Bolt1