Tuesday, July 19, 2011

S'ema Forex Trading Strategy

This forex strategy called S'ema because it uses a combination of several indicators like ema and sma forex trend line. S'ema currently in stages of development and is been testing. So far it works well and effective in predicting price movement of any currency pair. During ranging/consolidation market the result is quite good, and when market in trending the forex strategy give a better results.

S'ema forex strategy works effective in almost any currency pair so far. In any chart time frame. Recommended to use in 15 min time frame and use 4H chart to see of the overall trend. But not recommended for use trading longer than day-chart.

Set up for S'ema forex strategy:

  • Candle stick
  • BB(14,2)
  • EMA(10)
  • EMA(20)
  • EMA(50)
  • EMA(100)
  • EMA(200)
  • STOCH, FULL (14,3,3)
  • ATR (14)

Long Position:
  1. See uptrend by direction of EMA's: open up in the same direction, at least EMA (200) is underneath
  2. In Stochastic, crossover below 20 line
  3. Crossover of EMA(10) SMA(14) (EMA should cross over SMA upwards)
  4. Close of the entire candle stick above and after crossover of EMA(10)&SMA(14)

Trigger: The close of the candlestick

Target: Recent swing high OR next 00/50 number (i.e. 1.4000, 1.4050)

Stop: The price of swing low extended with ATR(14) value. (i.e. swing low is 1.4089, and ATR(14) is 14; then, the stop is 1.4075)


Short Position:
Do the opposite. Stochastick must have crossover above 80 line. And Candlestick must close below the MA crossover.


Volatility: More distance between EMA's, more volatile.
Note: that in high volatility, it's ok to get in trade even if the only body part of candle is above the crossover.

Trendiness: More EMA's are in same direction, more trendy.
Note that if the price movement is so trendy (a.k.a. all EMA's are in same direction and fanning out upwards), it's ok to be greedy for the take profit (i.e. skipping one 00/50 value).

For really greedy trader and risk taker, it's not too bad to trade with this S'ema forex strategy against the trend as long as for the short term (i.e. 15-min chart).

Source: Babypips.com

Monday, June 27, 2011

5M Kevinator Retracement Forex System

5m Kevinator Retracement Forex System is a forex strategy that is run based on the trend by using the multi time frame stochastic indicator see the current market trend. This forex system was used for major currency pairs only (EURUSD, USDCHF, GBPUSD, AUDUSD, USDCAD) in 5 minutes chart only. If the market is stepping up then you take buy retracement bars.If the market is stepping down you take the sell retracement bars.

Retracement bars are the magneta (purple) bars on the indicator on the bottom. If the market is stepping down you take the downward magneta bars as entry. If the market is stepping up you take the upward magneta bars as entry.

Longterm
You can either enter the market (long term) when the mtf stochastics is changing directions and hold until trend is done or at any of the retracement bars going in the direction of the trend and hold (20-400 pips).

Shortterm
You can scalp the market by finding the direction of the current trend (stepping up or stepping down) and entering the retracement bars and taking 5 to 20 pips profit.

There are two ways to trade this system but the entry rules are solid.We have a solid method to define a trend (mtf stochastics) and a solid entry method ( enter on retracements).

It is up to you how much profit you take as you could be following a trend for days or just scalping all day long for short profits.

5M Kevinator Retracement Forex System image 1

5M Kevinator Retracement Forex System image 2

5M Kevinator Retracement Forex System image 3

If you're interested by this forex system download 5M Kevinator Retracement Forex Indicator here DOWNLOAD

Source: Forexfactory.com

Thursday, November 18, 2010

Koala Forex Trading System

Koala forex system is an easy forex method, even for a beginner in forex trading can also do this forex method. Koala forex strategy based on trend follower sytem, using several indicators of Moving Average. This method will prevent traders to enter the market against the market trend and increased their success in forex trading.

Now let us see how to do the settings in your metatrader. And rules should you do for this forex strategy that can bring you to success in forex trading.


1. Deploy 3 Moving Averages indicator on the chart. Parameters are
  • Smoothed
  • Applied to Median Price ( High + Low / 2 )
  • Period of 3 ( Red ) , 6 ( Green ) , 9 ( Blue )

These  3 Moving Average give us our primary indicators.


2.  Next deploy 2 moving averages on the chart. Parameters are

First Moving Average:
  • Exponential
  • Applied to Closing Price
  • Period of 200 ( Black )

Second Moving Average

  • Smoothed
  • Applied to Median Price ( High + Low / 2 )
  • Period of 50 ( Brown )

This two moving averages will serve as our secondary indicators.


Koala Forex Trading Rules

While you can use any value for your stop loss and take profit, in view of proper risk and reward ratio and money management, recommended sets are

  • 30 SL 30 TP ( Normal )
  • 50 SL 50 TP ( Challenging )
  • 30 SL 50 TP ( Very challenging )

The more challenging the values are, the more precise your entries should be.


Buy or sell opportunity will surface when

  • Primary indicators becomes parallel towards the direction of the trade
  • Brown secondary indicator is in the same direction and is not turning in towards the primary indicators. This functions as an immediate support or resistance warning too as the price often react to the moving average
  • Black secondary indicator is not near the price action and hence not a potential strong support or resistance

    Koala Forex Trading System


    Exceptional conditions

    As the system relies heavily on trends, there are certain market conditions that will affect the performance of the system greatly
    • Low trading volume conditions resulting in no trends
    • Excessive flipping of the price action due to volatility
    • Major economic events resulting in unexpected spikes and momentum
    • A major support and resistance / trend line is not in the immediate region of the momentum.

    Learn More abot Forex strategy at www.babypips.com

      Wednesday, November 10, 2010

      1-2-3-4 Forex Trading Method

      1-2-3-4 Forex Trading Strategy is a simple strategy almost equal to the forex system 123, but with an additional step that is point 4. A typical 1-2-3-4 chart pattern is best traded after a strong currency pair up - or downtrend and can be defined by an easy set of trading rules. A trader can confirm the reversal trade using a technical indicator such as DMI or MACD.

      Some traders said that this forex strategy has a good success rate in reading the direction of the market price. Recommended to apply this forex strategy on 1H chart or greater and avoid to use it on smallerr time frame.


      1-2-3-4 Basic Rules for Short Trades
      • Point 1: The high in an up trending currency market.
      • Point 2: A downward correction in the up trend, the lowest bar in the correction before the price moves back up to point 3.
      • Point 3: The high in the move up from Point 2 but a failure to make a new higher high (Point 1).
      • Point 4: Go short 1 pip below point 2

      1-2-3-4 Forex Trading Method


      1-2-3-4 Basic Rules for Long Trades

      The reverse is true when applying these basic rules for long trades but now:

      • Point 1: The low in a down trending currency market.
      • Point 2: An upward correction in the downtrend, the highest bar in the correction before the price falls back up point 3.
      • Point 3: The low in the move down from Point 2 but a failure to make a new lower low (Point 1).
      • Point 4: Go long 1 pip above point 2


      1-2-3-4 Up Forex Reversal Strategy using MACD 

      1-2-3-4 Forex Trading Method

      1. Trade this reversal pattern only after a strong downtrend
      2. Place points 1,2 and 3 on your chart
      3. Place a BUY order 1 pip above 2
      4. Confirm the trade using the MACD indicator (or another); the MACD must signal a buy or in buy mode already.
      5. Target level: Calculate the distance between 2 and 3; if for example the distance between 2 and is 50 pips, than 50 pips is your target level.
      6. Place your stop 1 pip below 3


      1-2-3-4 Down Forex Reversal Strategy Using DMI

      1-2-3-4 Forex Trading Method


      1. Trade this reversal pattern only after a strong up trend
      2. Place points 1,2 and 3 on your chart
      3. Place a SELL order 1 pip below 2
      4. Confirm the trade using the DMI indicator (or another); DMI must signal a sell or in sell mode already.
      5. Target level: Calculate the distance between 2 and 3; if for example the distance between 2 and 3 is 250 pips, than 250 pips is your target level.
      6. Place your stop 1 pip above 3

      Source: www.aboutcurrency.com

      Thursday, November 4, 2010

      Isakas Ashi Forex Strategy

      Isakas Ashi by Kuskus Oosentogg Forex strategy is based on trend forex system. Its trade approach relies on the EMA 4 and 24 crossover. And then confirm the cross with the histogram and the heiken ashi indicators. This forex srategy works with almost pairs, and you need to use it on the M30 or H1 timeframe. You can use higher timeframes if you want but not for lower timeframes.

      Download: Isakas Ashi Indicator

      The entry rules are easy and clear to spot on the forex charts.

      Open SHORT(SELL) position when:

      1. The EMA 4 crosses BELOW the EMA 24
      2. Histogram is RED
      3. Heiken Ashi is RED
      4. When ZigZag makes a new HIGH (peak)

      Isakas Ashi Forex Strategy short position

      Open LONG (BUY) position when:

      1. The EMA 4 crosses ABOVE the EMA 24
      2. Histogram is GREEN
      3. Heiken Ashi is GREEN
      4. When ZigZag makes a new LOW (valley)

      Isakas Ashi Forex Strategy long position

      Stoploss, you should use the previous HIGH (Peak) as your stoploss for your short trades and use the LOW (valley) as your stoploss for your long trades.

      For the takeprofit, I suggest you use a trailing stoploss of 15-20 pips for slow pairs and 30-40 pips for pairs that move much more like the gbpusd. You can also takeprofit whenever the trades reach a fixed pips in profit, then re-enter again and again. There are numerous approach which is possible regarding the takeprofit but I am not able to cover them here.

      This system is very easy to use but you will need some practice with it in order to get acquainted with the system. Hope you will be making some pips. Enjoy your trading. -www.fxfisherman.com-

      Friday, September 24, 2010

      Blue Trend Rider Forex System

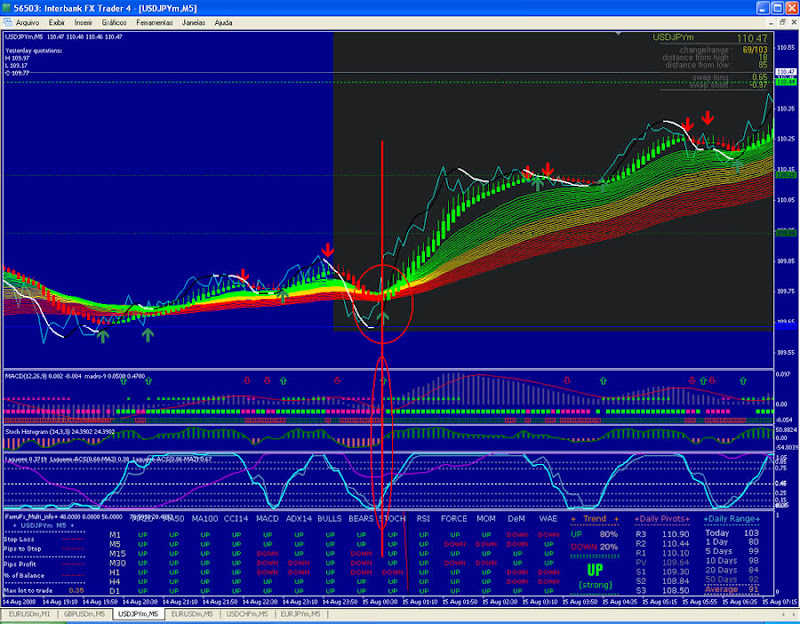
      Blue Trend Rider Forex System is a scalping forex strategy, it works on 5 minutes chart time frame so this forex strategy also known as 5MBlueTRS - 5 Minutes Blue Trend Rider System. Just like its name this forex trading strategy is based on Trend System that means you only trade in the direction of the trend. Good traders always trade in the direction of the trend. Before use this system it's better for you to know the trend for actual week and month. You can get it from forex articles, forex forum or forex review.
      How to Use This Forex Strategy
      • Copy all the indicators to the expert > Indicators folder. File for the metatrader 4.  You can download all Indicator here
      • Load 5minBluet Template.
      • Check where the trend is going from the beggining of the Day.
      • Best Time: EUR open till US Closes
      • Pairs: Low Spread Pairs

      Long Signals:
      1. Green Yellow red Rainbow – Green must be above red ( trend direction)
      2. Big Green Arrow in the Chart. Small Green Arrow in the MACD/MADRO
      3. MACD – above or crossing 0 line (or almost crossing going up)
      4. MADRO9 – Green X and Square.
      5. Stoch Histogram – Crossing 0 line up.
      6. The 2 blue Laguerre lines Crossing 0,15 to 0,25 up. If Magenta line is Crossing down in the 0,25 to 0.15 means a strong signal.
      7. Ferrufx – Trend Indicator Must be Green, UP and Strong (over 75 %).
      Note: You dont have to get all the signals to enter a trade. But IF all the signals are there at the same time, it should be a crystal clear entry.

      Thumb-5MBlueTRS-Trend-Rider-System-Long-Position

      Short Signals:
      1. Green Yellow red Rainbow –Green must be below red ( trend direction)
      2. Big Red Arrow in the Chart. Small Red Arrow in the MACD/MADRO
      3. MACD –Below or crossing 0 line (or almost crossing going down)
      4. MADRO9 –Red Square and Red X.
      5. Stoch Histogram – Crossing 0 line down.
      6. The 2 blue Laguerre lines Crossing 0,85 to 0,75 up. If Magenta line is Crossing up in the 0,75 to 0.85 means a strong signal.
      7. Ferrufx – Trend Indicator Must be red, Down and Strong (over 75 %).

      Thumb-5MBlueTRS-Trend-Rider-System-Short-Position

      The First Signal that you look is the Big Arrows which comes with na Alert sound. Then you look to stoch see IF its crossing, then look Laguerre, Macd and MADRO 9 and Trend Indicator.
      You enter the next bar after the Big Signal Arrow, If you are not sure, you can wait 1 more bar to see if more signals shows. Signals that must be the there to enter a trade: Rainbow in the Rigth Direction, Big Arrow, Laguerre , Stoch, TREND STrong.
      The best signals are after retracements and after slow market movement.

      Exits:
      You may exit anyway you want. Signals for exits: Signal Line changes color, heiken_dash Changes Color, a new Arrow in the other Direction shows, or you may use a 15 or 20 Pips trailing stops with no take limit, you may end up getting 100 pips or so.
      Stop Loss:
      Use what fits you Best. As long as you are riding the trend, you only get to lose if the trend changes direction and you may manualy close the trade IF the TREND INDICATOR in the FERRUFX goes down to 65% or 60 %. This way you only lose a few pips, and when you win you win a lot. You may use 25 pips stop loss and change it manually as you win pips.

      You can trade the ASIAN MArket when the EU and US Markets are closed. The Black Background is the Present Day, check where it begins to know the trend for the Day you are trading.  Leo_BR

      Wednesday, September 1, 2010

      Intraday Forex System Using Moving Average

      This forex system called intraday because it’s very simply work on 30 minutes chart time frame, although you can use it for 1Hour Chart for midterm trading. Intraday forex system base on breakout or cross of  Moving Average and price action. You can use major pairs  for this forex system

      Intraday System Setup:
      • Set the chart pattern to filled candle.
      • Set the timeframe to 30 minutes
      • Set up a moving average line period to 11 days.
      • MACD  set 2, 10, 4
      You can add  your own indicators for reassurance and entrance/exit, etc.

      How to trade
      What you are looking for is the moving average line, where the MA crosses the price line. You don’t need to care about it crossing the thin peaks of the high/low lines on the candle, but you have to concentrate on it crossing through the middle of the wide, filled part of the candle, the open close prices. And further yet, it must cross in around the middle of this center section. If it crosses at the top or bottom of the candle centre area, than you can pretty much disregard the trade. It may be profitable, but not worth the risk. Stick with the center of the central region and you will be much safer.

      Now to determine direction. If the MA moves from above the price line to below it, the trade is going to be long. And likewise, if the MA moves through the candle from below the price line, the trade will be short. This can be verified by checking your indicators that you have set up to corroborate with your MA. To better clarify this direction idea, if after the cross the price is below the MA, the price is most likely dropping or SHORT. If the after the cross the price is above the MA, the price is considered to be rising and the trade is LONG.
      intraday trading system
      Filter
      When the MA crosses the price line through the center of the l wide part of the candle.  You should try and wait at least one more candle before entering a position just to ensure that the cross wasn’t a blip on the radar and its not about to recant its previous move. The chart is set to the 30 minute timeframe, so generally wait 30 minutes or so, unless the market suddenly takes a quick shift in that direction. Then you can open the position to catch the swing.

      Another important factor to consider. If the MACD average lines are above the zero line, then you can expect a large climb. If the trade was reported as short, and the average lines on the MACD screen were below the zero line, you could expect to a see a rather large drop.

      Stop Loss and Profit
      When I say large drop or gain, I am speaking of 75, 100, 150 point gains. This is not to say that if, on a long trade for instance, the average lines on the MACD are BELOW the zero that you will NOT see a gain. It generally will provide a gain, but of 20, 30, or maybe even 50 points. Where you exit the trade is up to you and how much you can tolerate and are willing to risk. If you feel comfortable taking 30 points and are okay with yourself if it does end up going to 150 points above your buy price, then good for you. If you are a thrill-seeker and go for the 150, I wish you all the best of luck! You may or may not need it.