Showing posts with label 5 Minutes Strategy. Show all posts

Wednesday, August 20, 2014

The Bladerunner Forex Strategy

The Bladerunner forex strategy is a price action trading so it using tools like candlesticks, pivot points, round numbers and support and resistance levels when trading this strategy. But you can add more indicators if you think that they're useful or you feel more comfortable having some extra confirmation.

In this article we use the 20 EMA for confirmation indicator. Another alternative is to use the midline of the standard 20 Bollinger bands. Either works well, in fact you can use both to trade it as a Bollinger band EMA strategy.

The Bladerunner forex strategyp can be traded on any pair. It can also be traded on any time frame, but the examples below are from 5 min charts.

It can be traded at almost any time of the day, but obviously some times are more reliable than others. For example, the early part of the Asian session may provide a decent break out and retest giving an entry, whereas the Asian afternoon session can be very slow. Then, when London opens the price may be too erratic and volatile to give any reasonable entries for any strategy.

Later again, after the initial flurry of news announcements has passed and price has settled, you may once more get a reliable entry or two. You will therefore have to adjust this strategy to the times when you are able to trade it.

The strategy is named Bladerunner because the 20 EMA acts like a knife edge dividing price. If price is above the EMA, and respecting it, and retests the EMA, it will likely reject to the long side. And if price is below the EMA, and respecting it, and retests the EMA, it will likely reject to the short side. A few examples might help to clarify:


If price is below the 20 EMA, our bias is short and we would be looking for price to move up and hit the 20 EMA, reject and then move down.

However, if price pierces the 20 EMA and closes convincingly above it, we deem price to have switched polarity and now our bias changes to long. (This can be seen occurring at the right of the above picture). From now on we would be looking for price to move down and hit the 20 EMA, reject and then move up.

An example of one definite and one possible losing trade:


Essential entry parameters for this setup are:

  • Price must break out of consolidation or a range prior to entry, i.e. it must be trending
  • Price must then retest the 20 EMA successfully


What constitutes a successful retest?

If price is above the EMA it must bounce from and stay above the EMA; and vice versa for when price is below the EMA. More specifically: The first candle that touches the EMA should close on the same side of the EMA as it approached it from.

This then becomes the signal candle. Price has now rejected from the EMA and we are looking to see if the next candle confirms the move. If the next candle continues the move away from the EMA then this candle becomes the confirmatory candle. This is a simple way to trade the strategy; if you want to play it safer you could insist on a recognisable forex candlestick pattern occurring to confirm the trade.

n.b. if the Bladerunner seems simplistic, it is because forex price action and current fundamentals are factored into trading decisions. No entry is ever taken based purely on price having rejected from the 20 EMA.

Impotant Notes:

  • Always look for a confluence of reasons to enter the trade. For example, it’s safer to have more than just a rejection from the 20 EMA. Ideally, you would like to see this happening at the same place as an old support/resistance level, pivot level or other significant price impact point.
  • Always be on the lookout for impending news announcements when trading this setup, especially on the lower time frame charts. I generally will not enter any trade within 30 to 45 mins before a scheduled news event, and will always wait at least 15 mins after the event before considering a trade.
  • Always trade with the direction of the current trend, as determined by which side of the EMA or polarity indicator price is currently on.


Order Placement:

(Note: the following parameters call for spreading your entry across two orders, but nowadays I have found that it is simpler for me to just enter one position/order per trade. However, many traders prefer to have their trade split across two positions, as this enables them more flexibility in their exits.)

A suggested approach is to open 2 orders when trading this strategy. The orders are as follows:

For a long entry:

  • 2 buy stop orders are placed with entry 2 pips above the confirmatory candle.
  • Orders expire at the start of a new candle. For example, if entering limit orders on the five-minute chart, those orders will expire at the start of the next five-minute candle, unless they have already been filled by price action on the current five-minute candle.
  • The stop loss is placed 2 pips below the signal candle that touched the 20 EMA. This particular rule is not set in stone, you may place the stop behind a recent swing point if you believe that would give a more realistic stop size.
  • The take profit for the first order is set at an amount equivalent to the risk in pips. For example, if the risk in the trade is 20 pips, the first order’s take profit target will be set at 20 pips.
  • The take profit for the second order is set at an amount equivalent to double the risk in pips. So, to use the above example, the take profit on the second order would be set at 40 pips.

For a short entry:


  • 2 sell stop orders are placed with entry 2 pips below the confirmatory candle.
  • Orders expire at the start of a new candle. For example, if entering limit orders on the five-minute chart, those orders will expire at the start of the next five-minute candle, unless they have already been filled by price action on the current five-minute candle.
  • The stop loss is placed 2 pips above the signal candle that touched the 20 EMA. This particular rule is not set in stone, I may place the stop behind a recent swing point if I believe that would give a more realistic stop size.
  • The take profit for the first order is set at an amount equivalent to the risk in pips. For example, if the risk in the trade is 20 pips, the first order’s take profit target will be set at 20 pips.
  • The take profit for the second order is set at an amount equivalent to double the risk in pips. So, to use the above example, the take profit on the second order would be set at 40 pips.


Trailing stop:

Once price has moved in favour of the trade by an amount equivalent to the initial risk, one of the orders is closed (due to its reaching take profit 1 level) and the stop loss on the remaining order is moved to breakeven. Using the above examples, once price moves 20 pips in favour of the trade, the first order is closed and the stop loss on the remaining order is set to breakeven.

This remaining order’s stop is then left at breakeven until the market closes the trade, either by reaching the profit target or by stopping out at breakeven. Again, this rule is not set in stone: there may be times when you may wish to continue trailing the stop beyond breakeven, for example, when a news announcement is imminent.


Thursday, February 20, 2014

5 Minutes Momo Forex Strategy

The name of the system is 5 Minute Momo Forex Strategy. This forex system was introduced at "High Probability Trading Setups for the Currency Market" By Kathy Lien and Boris Schlossberg.  It is a simple Scalping Strategy using indicators of EMA and MACD.


Setup
EUR/USD 5 Minutes timeframe
EMA period 20
MACD  (12,26,9)


Open Buy Position When:

  1. Look for currency pair to be trading below the 20-period EMA and MACD to be negative
  2. Wait for price to cross above the 20-period EMA, make sure that MACD is either in the process of crossing from negative to positive or have crossed into positive territory no longer than 5 bars ago
  3. Go long 10 pips above the 20-period EMA
  4. For aggressive trade, place stop at swing low on 5 minute chart. For conservative trade, place stop 20 pips below 20-period EMA
  5. Sell half of position at entry plus amount risked, move stop on second half to breakeven
  6. Trail stop by higher of breakeven or 20-period EMA minus 15 pips


Open Sell Position When

  1. Look for currency pair to be trading above the 20-period EMA and MACD to be positive
  2. Wait for price to cross below the 20-period EMA, make sure that MACD is either in the process of crossing from positive to negative or have crossed into negative territory no longer than 5 bars ago
  3. Go short 10 pips below the 20-period EMA
  4. For aggressive trade, place stop at swing high on 5 minute chart. For conservative trade, place stop 20 pips above 20-period EMA
  5. Buy back half of position at entry minus amount risked, move stop on second half to breakeven
  6. Trail stop by lower of breakeven or 20-period EMA plus 15 pips

Tuesday, February 11, 2014

Tom's Simple 7 Strategy

Tom's Simple 7 forex strategy using EMA indicator setting 7 (close) as a determinant in taking open position. This scalping forex strategy work good on any time frame. It's a simple strategy but good enough to read the direction of price movement. Premises should be combined with higher timeframe. And you can add your indicators if you like.


How to setup the chart:

  • Set a 7 close price EMA.
  • Set a 50 close price EMA
How to Trade

If the 7 EMA is lower than the 50 EMA trade only the short opportunities for maximum risk/reward. So if the closed candles are below the 7 EMA trade short.

If the 7EMA is higher than the 50 EMA trade only the long opportunities for maximum risk/reward. So if the closed candles are above the 7 EMA trade long.


This is a trend-based strategy. The 50 EMA is there to indicate an increasing, decreasing or consolidation trend. I would not be interested in trading this strategy in a period of consolidation.

Warning:
These instructions expect that you have basic trading experience and is not meant to teach or train you in trading derivatives or forex. With that said, you can use this method on any timframe, but since we are differentiating the positions above and below the 7 EMA that means you will have to monitor your trade constantly after you enter it.

Note:
This method was left simple to allow people to use it as I basically set it forth, but also to allow you to adjust it to meet your needs and allow room for your new ideas based on it.

Wednesday, July 3, 2013

Genesis Matrix Trading System

This forex strategy use Heiken Ashi candles as the main indicator. This is because
1. HA candles tend to smooth out a lot of the 'noise' associated with trading the M5 chart
2. It prevents you becoming biased to the long or short side due to traditional Japanese candlestick patterns and formations, which are inherently unreliable on the small Time Frames (TF).

Though looks like a simple forex strategy but this strategy is not for new beginner trader. At least you already know how trading with Metatrader for a few months.
Genesis Matrix Trading System works on all time frame but suggested using the M5 or M15. Works best in a trend rather than a ranging market. Can use in any pair. Gold and Oil work as well also.

Genesis Matrix Trading System


This strategy is based on the following Genesis indicators :
• Genesis Matrix
• Heiken Ashi candles
• EMA 5 (yellow line)
• M5 stochastic
• M15 MTF stochastic
• M5 Arrow
• M15 MTF Arrow

ENTRY RULES

ENTRY 1 : Standard Genesis LONG/SHORT rule
1) 4 matrix dots with the same colour after the current bar is closed.
2) M5 stoch crossover and moving out from 20-80 overbought levels.
3) HA bar open above/below EMA5.
The M5 Arrow…..now we don’t always wait for the arrow because in a sudden PA reversal it may be late…but….if a M5 arrow doesn’t arrive within the next couple of candles, the trade must be monitored more closely for a possible early exit.

ENTRY 2 : 5_15 Genesis LONG/SHORT rule
This entry is the same as standard one but we use M15 arrow as a filter and we enter in the market only in the direction of the M15 arrow. As you can see from the following statistics, this increases the return of the system using either exit strategy.

Download Genesis Matrix Trading System eBook
Download Indicator and template

Learn more about this System at Forex Factory


Monday, June 27, 2011

5M Kevinator Retracement Forex System

5m Kevinator Retracement Forex System is a forex strategy that is run based on the trend by using the multi time frame stochastic indicator see the current market trend. This forex system was used for major currency pairs only (EURUSD, USDCHF, GBPUSD, AUDUSD, USDCAD) in 5 minutes chart only. If the market is stepping up then you take buy retracement bars.If the market is stepping down you take the sell retracement bars.

Retracement bars are the magneta (purple) bars on the indicator on the bottom. If the market is stepping down you take the downward magneta bars as entry. If the market is stepping up you take the upward magneta bars as entry.

Longterm
You can either enter the market (long term) when the mtf stochastics is changing directions and hold until trend is done or at any of the retracement bars going in the direction of the trend and hold (20-400 pips).

Shortterm
You can scalp the market by finding the direction of the current trend (stepping up or stepping down) and entering the retracement bars and taking 5 to 20 pips profit.

There are two ways to trade this system but the entry rules are solid.We have a solid method to define a trend (mtf stochastics) and a solid entry method ( enter on retracements).

It is up to you how much profit you take as you could be following a trend for days or just scalping all day long for short profits.

5M Kevinator Retracement Forex System image 1

5M Kevinator Retracement Forex System image 2

5M Kevinator Retracement Forex System image 3

If you're interested by this forex system download 5M Kevinator Retracement Forex Indicator here DOWNLOAD

Source: Forexfactory.com

Friday, September 24, 2010

Blue Trend Rider Forex System

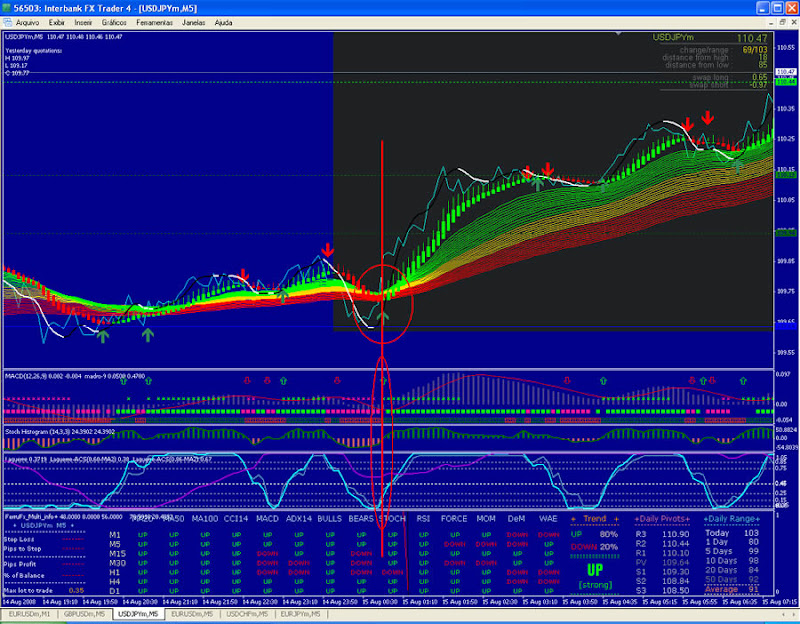
Blue Trend Rider Forex System is a scalping forex strategy, it works on 5 minutes chart time frame so this forex strategy also known as 5MBlueTRS - 5 Minutes Blue Trend Rider System. Just like its name this forex trading strategy is based on Trend System that means you only trade in the direction of the trend. Good traders always trade in the direction of the trend. Before use this system it's better for you to know the trend for actual week and month. You can get it from forex articles, forex forum or forex review.
How to Use This Forex Strategy
  • Copy all the indicators to the expert > Indicators folder. File for the metatrader 4.  You can download all Indicator here
  • Load 5minBluet Template.
  • Check where the trend is going from the beggining of the Day.
  • Best Time: EUR open till US Closes
  • Pairs: Low Spread Pairs

Long Signals:
  1. Green Yellow red Rainbow – Green must be above red ( trend direction)
  2. Big Green Arrow in the Chart. Small Green Arrow in the MACD/MADRO
  3. MACD – above or crossing 0 line (or almost crossing going up)
  4. MADRO9 – Green X and Square.
  5. Stoch Histogram – Crossing 0 line up.
  6. The 2 blue Laguerre lines Crossing 0,15 to 0,25 up. If Magenta line is Crossing down in the 0,25 to 0.15 means a strong signal.
  7. Ferrufx – Trend Indicator Must be Green, UP and Strong (over 75 %).
Note: You dont have to get all the signals to enter a trade. But IF all the signals are there at the same time, it should be a crystal clear entry.

Thumb-5MBlueTRS-Trend-Rider-System-Long-Position

Short Signals:
  1. Green Yellow red Rainbow –Green must be below red ( trend direction)
  2. Big Red Arrow in the Chart. Small Red Arrow in the MACD/MADRO
  3. MACD –Below or crossing 0 line (or almost crossing going down)
  4. MADRO9 –Red Square and Red X.
  5. Stoch Histogram – Crossing 0 line down.
  6. The 2 blue Laguerre lines Crossing 0,85 to 0,75 up. If Magenta line is Crossing up in the 0,75 to 0.85 means a strong signal.
  7. Ferrufx – Trend Indicator Must be red, Down and Strong (over 75 %).

Thumb-5MBlueTRS-Trend-Rider-System-Short-Position

The First Signal that you look is the Big Arrows which comes with na Alert sound. Then you look to stoch see IF its crossing, then look Laguerre, Macd and MADRO 9 and Trend Indicator.
You enter the next bar after the Big Signal Arrow, If you are not sure, you can wait 1 more bar to see if more signals shows. Signals that must be the there to enter a trade: Rainbow in the Rigth Direction, Big Arrow, Laguerre , Stoch, TREND STrong.
The best signals are after retracements and after slow market movement.

Exits:
You may exit anyway you want. Signals for exits: Signal Line changes color, heiken_dash Changes Color, a new Arrow in the other Direction shows, or you may use a 15 or 20 Pips trailing stops with no take limit, you may end up getting 100 pips or so.
Stop Loss:
Use what fits you Best. As long as you are riding the trend, you only get to lose if the trend changes direction and you may manualy close the trade IF the TREND INDICATOR in the FERRUFX goes down to 65% or 60 %. This way you only lose a few pips, and when you win you win a lot. You may use 25 pips stop loss and change it manually as you win pips.

You can trade the ASIAN MArket when the EU and US Markets are closed. The Black Background is the Present Day, check where it begins to know the trend for the Day you are trading.  Leo_BR

Friday, November 14, 2008

The Force 5 Minutes System

The force 5 minutes forex system produced good profits if traded correctly. By good profits it could make pips everyday even if its only a few. Tested on the Eur/Usd pair, on 5 minutes time frame. recommended trade in asian or europe session.


Indicators

MACD: 12,26,1 ( 1 means nothing )
Stochastic: 5,3,3
EMA: 5 to the close
EMA: 5 to the open

No trades during news times, Risk is set to 2%, take profit is random based on market conditions but ill usually cash out based on reversal patterns or a cross of the two ema's. Trade signals are only confirmed on closed candles/bars.

Buy Signal

a) When the stochastic crosses up from the 20 line and is not ovebought
b) The MACD closses higher than the previous time interval
c) The Signal candle/bar closes higher bullish
d) The 5 ema to the close has crossed the 5 ema to the open

Stop Loss is the low of the previous candle or 20 pips but 20 pip min.
Close when the 5 ema to the close has crossed the 5 ema to the open

Sell Signal

a) When the stochastic crosses down from the 80 line and is not oversold
b) The MACD closses lower than the previous time interval
c) The Signal candle/bar closes lower bearish
d) The 5 ema to the close has crossed the 5 ema to the open

Stop Loss is the high of the previous candle or 20 pips but 20 pip min.
Close is based on price action.


By Forexjedi from forexfactory.com

Monday, September 15, 2008

KAS37 Trading System

I have been trading with success, my own trading system, called KAS37 Forex Trading System. I Hope every Forex Trader would benefit from it.

Try it in demo account first, get the feel.

SETUP :

1. Bollinger Band (BB), 20,0,2 - Default.
2. RSI 3 and RSI 7
3. Stochastic 7,3,3
4. Simple Moving Average, SMA 3 and SMA7
5. Pair - GBPJPY, 5 Min Chart. (the rest of the other pair, I wouldn't guarantee of success)

ENTRY RULES:

Buy Entry
a. Stoch cross up from below 20 (or less than 30)
b. RSI 3 and RSI 7 cross up from below 30.
c. SMA 3 and SMA 7, cross up between Lower BB and Mid BB.

Sell Entry
a. Stoch cross down from above 80 (or greater than 70)
b. RSI 3 and RSI 7 cross down from above 70.
c. SMA 3 and SMA 7, cross down between Upper BB and Mid BB (for sell entry, This doesn’t matter)


STOP LOSS (SL) & TARGET PROFIT (TP)

a. SL is 30 pip, (or 2 pip plus spread above or below previous swing High or Low)
b. TP is 30 pip (or trail the profit if you are in profit)
c. Move SL to breakeven when in 20 pip profit.
d. If price doesn't hit target profit within 30 min to 1 hr, Close it at best profit.


IMPORTANT NOTES:

1. The rules must follow step a, b then c, NOT b, a then c, as you would not get valid signals.
2. Exception of entry rules, of RSI (cross above 70 or below 30) and Stoch (cross above 80 or below 20), can only be done, if and only if, u see divergence with 3 Spikes of Higher Highs or Lower Lows.
3. You may enter early by following signal a. and then b. without waiting for c. to confirm. BUT, it has 90% success rate - i choose to enter on this entry.
4. It is that prior to entry based on the rules stated above, that the previous 2-3 bars length shall be less than 20 pips


By Caireono from www.forexfactory.com

Thursday, April 3, 2008

Fibonacci Trading An Scalping Technique

Every trader should know how to plot the Fibonacci retracement and projection with ease. However, not everyone who knows how to calculate the Fibonacci levels knows how to trade under real market condition.

To trade the Fibonacci retracements and projections effectively, a trader must also understand the price action of the forex market. And using candlestick formation is one of the most effective ways to determine the immediate market sentiment.

A hanging man formation during a downtrend shows that the bears are losing strength and the trend is about to reverse. At the same time, we must also acknowledge that there are also Fibonacci levels to concern about. The best scenario of a rejection at the Fibonacci level is when a candlestick showing a hanging man formation closes above the 38.2% level of a Fibonacci retracement. This setup proves that the uptrend is strong and the retracement is merely profit taking. The rejection at 38.2% level also reveals that more bulls are waiting at the sideline to enter the market at a more favorable market price.

Fibonacci Trading - Scalping Technique

Fibonacci trading can be used on any time frames, even as a scalping technique on a 5-minute chart and it can be quite profitable if you know how to do it in Forex trading. Let’s look at an example at the simple illustration below; assuming that the currency pair is on an uptrend movement and the price presumably has hit a top and then reversed. We would then draw the Fibonacci retracement on the uptrend shown in Point A. The price action then retraced to near 50% and encountered good support at that price.


How to enter a position

On a 5-minute chart, you should be able to tell that the candlestick formation would give you an immediate sign of a possible bounce. On the next candlestick after the low near the 50% retracement of Point A, open long if it closes higher low than the previous candlestick. Since this is a scalping method, your first profit should be the 50% retracement resistance level (Point B Fibonacci retracement) from the original Point A 0% retracement to 50% where your position is entered. You would probably think that the profit target from the point of entry should be the original 0% retracement but that is not usually true. As in any market conditions; we are not be able to tell where the price is going next. Remember that this is a scalping technique which should help you to reap about 15 to 20 pips depending on the range of the Fibonacci retracement is drawn. This is useful if you have a tight stop and prefer not to hold position for more than a hour. You should be able to see consistent good results using this simple technique.

Sensitive Fibonacci Retracement Levels

Using a retracement calculation, you should try to identify the 38.2%, 50% and 61.8% of the Fibonacci retracements. If an uptrend is strong, the price action will most likely to see strong support at 38.2%, while at 50% would see bears pushing hard to open the gate. 61.8% should then be seen as the bulls are retreating to heal their wounds with the momentum temporarily shift with the bears.


The Asian session saw a big fall on Euro against the Yen on Thursday. Technically, it was very obvious on the chart and I did a short trade on the currency pair. I had mentioned Fibonacci trading last Friday as one of the methods I used. I will show you how I did it with this short trade. During the early US session on Thursday morning Eastern Time, you should see that the price moved upwards to 156.84 before a bearish 15-minute candle started the downtrend. Keeping in mind that the low was 155.54 and then the recent top was at 156.84, we calculated that the retracement should see some support at 156.04 area (see the attached calculation on the right below).


I entered this short trade because I got a signal from my setup and it was aligned with the main day movement (downtrend). I then entered the price at 155.45 with stop-loss at 20 pips away. I set my profit target using my own calculated price 156.20 near the 61.8% retracement area. About 25 minutes later, the short position was done with a 25-pip gain. Why I entered at 156.45 was because on the 5-minute chart, there was a rejection at 156.58 which is the Fibonacci 38.2% level (155.84 to 155.42), therefore I entered at that price (also see the right calculation on the picture above).


I hope this example will gives you yet another positive aspect on Fibonacci trading in the Forex market.

By FXOperator - www.forextsd.com

Wednesday, January 10, 2007

Stryker Non Farm Payroll Strategy

Three things you can do when trading NFP (along with other data's associated with it)
  1. Don't trade at all that day
  2. If you have a live trade on for some certain time and its giving you at least above 80 pips in gains... place a breakeven s/l and let it run...worst come to worst it'll be a breakeven, otherwise you can easily add 150-200 pips to it, or even better you can hold the pair for longer term, as the real directional move after heavy consolidation (which is mostly seems to be the case prior to the NFP data). So now you can be sitting in the trend and enjoying awesomely
  3. This is what I do. Since NFP is the not the only data on board (there are others as well), so they could be mixed out (good and bad), and hence the scenario could be ugly.
So we have the good, the bad and eventually the ugly side of it as well. Add Federal Reserve Speech and you have perfect recipe for a disaster. Now watch the charts for some NFP data, as soon as it comes out… the first move that u c on the 5 mins graphs is usually the fake one. The real story kicks in the nxt 5 mins charts…. If the high of previous 5 mins is not taken out in the 2nd 5 mins graph, it usually means the top has been formed… I sell with my s/l above the high of previous 5 mins graphs. And my limit usually runs for 140-180 pips from there… risk/reward is beautiful…

However safer is still to watch the whole first 15 mins candle and then sell if the high doesn’t seems to be taken out… you probably won’t get a much better price, but still a good trade can be formed out. Vice versa if it’s shooting down initially.

A plus point being Federal Reserve Speech, where he needed to back bush upbeat comments about the dollar and the twin deficit and you can form a clue where it’ll eventually head…

The loss factor is still there. But if you compare R/R it’s worth a try to me…. And I do that almost every time. Sure I learned through bitter experience not to trade NFP, but this to me is much safer… and if it clicks, I just end up taking positions on other pairs as well w/o any prejudice. Of course when I’m in a very comfortable position in my original first pair and after a break of any major support/resistance on other pairs…. will i take positions.... at times ranging from 20-70+pips.....

EDIT: when watching the 5 minutes or the 15 minutes candles, keep in mind the close of the first initial candle needs to be way off from the high...... since its NFP and we are considering 5 minutes candles we cannot have a close to low below..... rememebr we are talking about NFP....
eg..... high on first 5 mins candle of euro was around 3040, the close was at 3027, however i think it dipped till 3015 on the first 5 mins on the first initial 5 min candles.... so a good sense that there is quite heavy selling interest that lies there.....
now the close was at around 3027.....on the first 5 mins candle. since i was out and didnot trade, i would have waited to short from around 3030/35 with s/l above 3058, since i was having first resistance showing at 3054...... my limits would have been initially around 2850/80 region.. s/l could still be 1 pip above the high of the first 5 mins candle....... but to my mental satisfaction, it would have been above 3054 resistance.