Showing posts with label 30 Minutes Strategy. Show all posts

Wednesday, August 20, 2014

The Bladerunner Forex Strategy

The Bladerunner forex strategy is a price action trading so it using tools like candlesticks, pivot points, round numbers and support and resistance levels when trading this strategy. But you can add more indicators if you think that they're useful or you feel more comfortable having some extra confirmation.

In this article we use the 20 EMA for confirmation indicator. Another alternative is to use the midline of the standard 20 Bollinger bands. Either works well, in fact you can use both to trade it as a Bollinger band EMA strategy.

The Bladerunner forex strategyp can be traded on any pair. It can also be traded on any time frame, but the examples below are from 5 min charts.

It can be traded at almost any time of the day, but obviously some times are more reliable than others. For example, the early part of the Asian session may provide a decent break out and retest giving an entry, whereas the Asian afternoon session can be very slow. Then, when London opens the price may be too erratic and volatile to give any reasonable entries for any strategy.

Later again, after the initial flurry of news announcements has passed and price has settled, you may once more get a reliable entry or two. You will therefore have to adjust this strategy to the times when you are able to trade it.

The strategy is named Bladerunner because the 20 EMA acts like a knife edge dividing price. If price is above the EMA, and respecting it, and retests the EMA, it will likely reject to the long side. And if price is below the EMA, and respecting it, and retests the EMA, it will likely reject to the short side. A few examples might help to clarify:


If price is below the 20 EMA, our bias is short and we would be looking for price to move up and hit the 20 EMA, reject and then move down.

However, if price pierces the 20 EMA and closes convincingly above it, we deem price to have switched polarity and now our bias changes to long. (This can be seen occurring at the right of the above picture). From now on we would be looking for price to move down and hit the 20 EMA, reject and then move up.

An example of one definite and one possible losing trade:


Essential entry parameters for this setup are:

  • Price must break out of consolidation or a range prior to entry, i.e. it must be trending
  • Price must then retest the 20 EMA successfully


What constitutes a successful retest?

If price is above the EMA it must bounce from and stay above the EMA; and vice versa for when price is below the EMA. More specifically: The first candle that touches the EMA should close on the same side of the EMA as it approached it from.

This then becomes the signal candle. Price has now rejected from the EMA and we are looking to see if the next candle confirms the move. If the next candle continues the move away from the EMA then this candle becomes the confirmatory candle. This is a simple way to trade the strategy; if you want to play it safer you could insist on a recognisable forex candlestick pattern occurring to confirm the trade.

n.b. if the Bladerunner seems simplistic, it is because forex price action and current fundamentals are factored into trading decisions. No entry is ever taken based purely on price having rejected from the 20 EMA.

Impotant Notes:

  • Always look for a confluence of reasons to enter the trade. For example, it’s safer to have more than just a rejection from the 20 EMA. Ideally, you would like to see this happening at the same place as an old support/resistance level, pivot level or other significant price impact point.
  • Always be on the lookout for impending news announcements when trading this setup, especially on the lower time frame charts. I generally will not enter any trade within 30 to 45 mins before a scheduled news event, and will always wait at least 15 mins after the event before considering a trade.
  • Always trade with the direction of the current trend, as determined by which side of the EMA or polarity indicator price is currently on.


Order Placement:

(Note: the following parameters call for spreading your entry across two orders, but nowadays I have found that it is simpler for me to just enter one position/order per trade. However, many traders prefer to have their trade split across two positions, as this enables them more flexibility in their exits.)

A suggested approach is to open 2 orders when trading this strategy. The orders are as follows:

For a long entry:

  • 2 buy stop orders are placed with entry 2 pips above the confirmatory candle.
  • Orders expire at the start of a new candle. For example, if entering limit orders on the five-minute chart, those orders will expire at the start of the next five-minute candle, unless they have already been filled by price action on the current five-minute candle.
  • The stop loss is placed 2 pips below the signal candle that touched the 20 EMA. This particular rule is not set in stone, you may place the stop behind a recent swing point if you believe that would give a more realistic stop size.
  • The take profit for the first order is set at an amount equivalent to the risk in pips. For example, if the risk in the trade is 20 pips, the first order’s take profit target will be set at 20 pips.
  • The take profit for the second order is set at an amount equivalent to double the risk in pips. So, to use the above example, the take profit on the second order would be set at 40 pips.

For a short entry:


  • 2 sell stop orders are placed with entry 2 pips below the confirmatory candle.
  • Orders expire at the start of a new candle. For example, if entering limit orders on the five-minute chart, those orders will expire at the start of the next five-minute candle, unless they have already been filled by price action on the current five-minute candle.
  • The stop loss is placed 2 pips above the signal candle that touched the 20 EMA. This particular rule is not set in stone, I may place the stop behind a recent swing point if I believe that would give a more realistic stop size.
  • The take profit for the first order is set at an amount equivalent to the risk in pips. For example, if the risk in the trade is 20 pips, the first order’s take profit target will be set at 20 pips.
  • The take profit for the second order is set at an amount equivalent to double the risk in pips. So, to use the above example, the take profit on the second order would be set at 40 pips.


Trailing stop:

Once price has moved in favour of the trade by an amount equivalent to the initial risk, one of the orders is closed (due to its reaching take profit 1 level) and the stop loss on the remaining order is moved to breakeven. Using the above examples, once price moves 20 pips in favour of the trade, the first order is closed and the stop loss on the remaining order is set to breakeven.

This remaining order’s stop is then left at breakeven until the market closes the trade, either by reaching the profit target or by stopping out at breakeven. Again, this rule is not set in stone: there may be times when you may wish to continue trailing the stop beyond breakeven, for example, when a news announcement is imminent.


Tuesday, February 11, 2014

Tom's Simple 7 Strategy

Tom's Simple 7 forex strategy using EMA indicator setting 7 (close) as a determinant in taking open position. This scalping forex strategy work good on any time frame. It's a simple strategy but good enough to read the direction of price movement. Premises should be combined with higher timeframe. And you can add your indicators if you like.


How to setup the chart:

  • Set a 7 close price EMA.
  • Set a 50 close price EMA
How to Trade

If the 7 EMA is lower than the 50 EMA trade only the short opportunities for maximum risk/reward. So if the closed candles are below the 7 EMA trade short.

If the 7EMA is higher than the 50 EMA trade only the long opportunities for maximum risk/reward. So if the closed candles are above the 7 EMA trade long.


This is a trend-based strategy. The 50 EMA is there to indicate an increasing, decreasing or consolidation trend. I would not be interested in trading this strategy in a period of consolidation.

Warning:
These instructions expect that you have basic trading experience and is not meant to teach or train you in trading derivatives or forex. With that said, you can use this method on any timframe, but since we are differentiating the positions above and below the 7 EMA that means you will have to monitor your trade constantly after you enter it.

Note:
This method was left simple to allow people to use it as I basically set it forth, but also to allow you to adjust it to meet your needs and allow room for your new ideas based on it.

Monday, September 17, 2012

Simple 10 Pips Forex Strategy

This is a simple forex strategy using basic indicators from MT4 or MT5 platform. Base on scalping system. We must be patient for waiting a good signal from this strategy. When there is a good setup then it can have around 80% winning rate. Recommended for practising in demo account until you familiar with this system. After that yo can go with your real account.

Requirements :
  1. Time Frame 15 or 30 M 
  2. Bollinger Bands in Default settings 
  3. Stochastic 5.3.3 in level 20 and 80 
  4. Pair with low spread 
How to trade :
When price out under line of bollinger bands the price will come back in bollinger again when the first candle close in bollinger Prove the intersection of lines in the indicator stochastic open order buy and your target be 10 pip only.


Click image to larger 


Click image to larger 


That's all simple but profitable, you'll decided...!


Sunday, March 25, 2012

Scalping 10 Pips Only Forex Strategy

This 10 pips forex strategy is scalping strategy very easy and simple to do, even if you are a beginner in forex trading. Use only Bolinger Band and Stochastic to predict price movements in the future. Although a simple strategy, but the author of this forex strategy claimed that it has a good profit.

Setting on your trader platform

  • Time Frame 15 or 30 M
  • Bollinger Bands Default settings
  • Stochastic 5,3,3 with level 20 and 80

That's all you need, remember because this's a scapling strategy so applies only to the currency pairs with low spreads.

Buy Order

When price out under line of bollinger bands, the price will come back in bollinger again
when the first candle close in bollinger Prove the intersection of lines in the indicator stochastic open order buy and your target be 10 pip only.

Scalping 10 Pips Only Forex Strategy


Sell Order

Do the same Buy Order with the opposite way

Scalping 10 Pips Only Forex Strategy


Source: Forum MT5

Thursday, November 4, 2010

Isakas Ashi Forex Strategy

Isakas Ashi by Kuskus Oosentogg Forex strategy is based on trend forex system. Its trade approach relies on the EMA 4 and 24 crossover. And then confirm the cross with the histogram and the heiken ashi indicators. This forex srategy works with almost pairs, and you need to use it on the M30 or H1 timeframe. You can use higher timeframes if you want but not for lower timeframes.

Download: Isakas Ashi Indicator

The entry rules are easy and clear to spot on the forex charts.

Open SHORT(SELL) position when:

1. The EMA 4 crosses BELOW the EMA 24
2. Histogram is RED
3. Heiken Ashi is RED
4. When ZigZag makes a new HIGH (peak)

Isakas Ashi Forex Strategy short position

Open LONG (BUY) position when:

1. The EMA 4 crosses ABOVE the EMA 24
2. Histogram is GREEN
3. Heiken Ashi is GREEN
4. When ZigZag makes a new LOW (valley)

Isakas Ashi Forex Strategy long position

Stoploss, you should use the previous HIGH (Peak) as your stoploss for your short trades and use the LOW (valley) as your stoploss for your long trades.

For the takeprofit, I suggest you use a trailing stoploss of 15-20 pips for slow pairs and 30-40 pips for pairs that move much more like the gbpusd. You can also takeprofit whenever the trades reach a fixed pips in profit, then re-enter again and again. There are numerous approach which is possible regarding the takeprofit but I am not able to cover them here.

This system is very easy to use but you will need some practice with it in order to get acquainted with the system. Hope you will be making some pips. Enjoy your trading. -www.fxfisherman.com-

Wednesday, September 1, 2010

Intraday Forex System Using Moving Average

This forex system called intraday because it’s very simply work on 30 minutes chart time frame, although you can use it for 1Hour Chart for midterm trading. Intraday forex system base on breakout or cross of  Moving Average and price action. You can use major pairs  for this forex system

Intraday System Setup:
  • Set the chart pattern to filled candle.
  • Set the timeframe to 30 minutes
  • Set up a moving average line period to 11 days.
  • MACD  set 2, 10, 4
You can add  your own indicators for reassurance and entrance/exit, etc.

How to trade
What you are looking for is the moving average line, where the MA crosses the price line. You don’t need to care about it crossing the thin peaks of the high/low lines on the candle, but you have to concentrate on it crossing through the middle of the wide, filled part of the candle, the open close prices. And further yet, it must cross in around the middle of this center section. If it crosses at the top or bottom of the candle centre area, than you can pretty much disregard the trade. It may be profitable, but not worth the risk. Stick with the center of the central region and you will be much safer.

Now to determine direction. If the MA moves from above the price line to below it, the trade is going to be long. And likewise, if the MA moves through the candle from below the price line, the trade will be short. This can be verified by checking your indicators that you have set up to corroborate with your MA. To better clarify this direction idea, if after the cross the price is below the MA, the price is most likely dropping or SHORT. If the after the cross the price is above the MA, the price is considered to be rising and the trade is LONG.
intraday trading system
Filter
When the MA crosses the price line through the center of the l wide part of the candle.  You should try and wait at least one more candle before entering a position just to ensure that the cross wasn’t a blip on the radar and its not about to recant its previous move. The chart is set to the 30 minute timeframe, so generally wait 30 minutes or so, unless the market suddenly takes a quick shift in that direction. Then you can open the position to catch the swing.

Another important factor to consider. If the MACD average lines are above the zero line, then you can expect a large climb. If the trade was reported as short, and the average lines on the MACD screen were below the zero line, you could expect to a see a rather large drop.

Stop Loss and Profit
When I say large drop or gain, I am speaking of 75, 100, 150 point gains. This is not to say that if, on a long trade for instance, the average lines on the MACD are BELOW the zero that you will NOT see a gain. It generally will provide a gain, but of 20, 30, or maybe even 50 points. Where you exit the trade is up to you and how much you can tolerate and are willing to risk. If you feel comfortable taking 30 points and are okay with yourself if it does end up going to 150 points above your buy price, then good for you. If you are a thrill-seeker and go for the 150, I wish you all the best of luck! You may or may not need it.

Monday, August 23, 2010

Panca Eagle Breakout Strategy

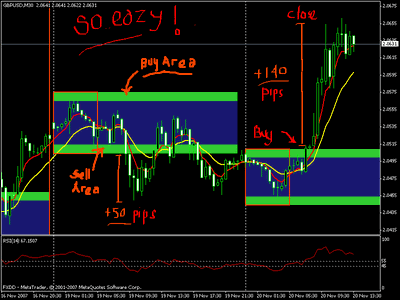
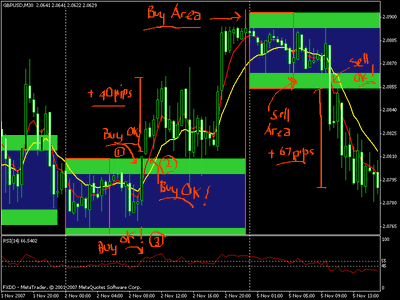
Panca Eagle forex strategy basically a method for determing support and resistance breakouts. The idea of this strategy is to determine previous range and take trading opportunities once the box is broken (with borders acting as support and resistance areas) using as a trigger the breaks above and below that range. Panca eagle indicator is simple enough to understand. It is not complicated to use; we just simply have to wait for a breakout above or below the green zone. As such, it requires no special skills in order to use it.
panca eagle breakout forex strategy

What you need
  • - Any pairs, EURUSD or GBPJPY recommended.
  • - Timeframe 30M - Panca Eagle Indicators
  • - EMA 5 (red line) and EMA 13 (yellow line)
  • - RSI 14 level 45 – 55
  • - Toptrend Indicators to avoid false signal.
Download all indicators here: Panca Eagle Indicators

Panca-Eagle Break Out Strategy rules:
1. Trading Hour:
You have to wait for the bars to get past the red box before you place an order at 10.30-21.00 WIB (GMT +7) in TF :30 Minute
2. Only 1 Buy & 1 Sell
3. No More Than 5-10% Equity each open trade
4. Minimum Take Profit = +10 pips for GU or GJ Pips protect, secure + 10 pips when your running profit +30 Trailing Stop 15 pips (optional)
5. You can use Pending Order : TP 30 ans SL 30 , Buy and Sell at Green Area After past the Box. But Recommended If You use instant execution.
6. How To Entry:
Buy when :
  • The price enter upper box green area after past the red Box 
  • EMA 5 (red line) Upper EMA 13 (yellow line)
  • RSI above 55 level
Sell when :
  • The price enter bottom box green area after past the red box
  • EMA 5 (red line) Below EMA 13 (yellow line)
  • RSI below 45 level
buy sell panca eagle forex strategy

 Avoid False Signal Using Toptrend Indicators
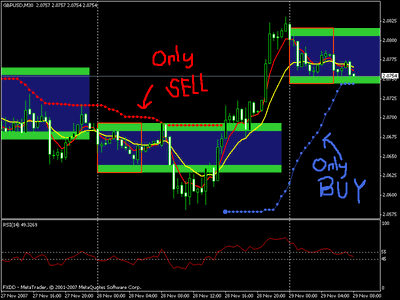
To Avoid False Signal, Before entering the market all signal must confirm with Toptrend  Indicator. Only doing sell position  if Toptrend Indicator is red and above price. And reverse only doing buy if Toptrend Indicator  is BLUE and below price.

Avoid False Signal Toptrend Indicator

Success Tips
1. Make sure and always confirm your action (buy/sell) with Trend Indicator (You can combine with your trend indicator). To help you avoid whipsaws.
2. Recommended to apply PIPSLOCK or TRAILING STOP example : pipslock rules:
  • Move your SL +5 after 20 pips profit.
  • Move your SL +10 after 30 pips profit
  • Move your SL +20 after 40 pips profit
  • Move your SL +30 after 60 pips profit etc….
3. Practice in demo account first to use pipslock… you can set pipslock according to your experience to protect your pips and you can use 15 pips trailing stop.
4.When current price is near buy/sell area, you shouldn’t do pending order. But if current price in middle of red box , You can put pending order with 15 pips Trailing Stop. But instant execution buy/sell, It’s recommended and for better result.

Source: www.fxstreet.com

Tuesday, July 24, 2007

Cornflower Hourly System

Construct a template according to the following settings:
8 EMA (yellow, dotted)
12 EMA (violet)
24 EMA (cornflower blue, hence the name)
72 EMA (khaki)

Apply to H1 (conservative) or M30 (aggressive) chart only and remove the grid for clarity.

System principles
Cornflower is based on the principle that trades should be taken when the same trend presents itself on multiple timeframes. On an hourly chart, the 24 EMA obviously defines the daily trend. The 8 EMA, which is one-third the length, shows the intraday velocity of “fast” money. A 12 EMA shows the trend of the last half-day. Its value is a place at which price will typically find support when there is a dominant trend. To a lesser extent, this also applies to the 24 EMA. A long-term trend will sometimes catch a breather around this area, with big money accumulating on the opportunity to buy or sell at a substantial discount. Finally, the 72 EMA defines the dominant trend in the market. This trend will reassert itself as cumulative memory persuades traders to resume trading in its direction. If the three shorter-term averages are above the 72 EMA, we are in an uptrend and should not go short. The same applies in reverse for a downtrend.

Cornflower can be used in a number of ways by all kinds of traders. When price pulls back to the area between the 12 and 24 EMAs, the opportunity for a short- to medium-term bounce presents itself. We can enter and set a profit target based on a number of criteria, be they support and resistance areas, pivot points, or a set pip amount. Or we can enter a longer-term trade, perhaps exiting when the 12 EMA crosses down below the 24 EMA. The longer-term setups in this system are powerful and can yield hundreds of pips on a single trade that will last for up to two weeks. Cornflower will catch every major move in the market, providing multiple opportunities to take advantage of a big trend and pretend that one is a bank trader.

Basic System Rules
There are two kinds of entries using this system: pullback (conservative) and initial (aggressive). The pullback entry, which is the heart of this system, enters the market when conditions are quiet and after price has settled into the area between the 8 and 24 EMAs. The timing of this entry can either be mechanical (using either the 12 or 24 EMA) or discretionary in accordance with the trader’s judgment on whether price is moving back in the direction of the trend.

The initial entry aims to capitalize on the first movement of a new trend, defined by a thrust beyond the 72 EMA that is confirmed by a turnaround in the shorter EMAs. It is more risky because there is always the possibility of a reversal. For this reason, it is probably better to use the M30 chart for this type of entry. Moved up by 30 minutes, one has the opportunity to take a small profit or scratch a trade at or near break-even if a reversal presents itself.

Only the H1 and M30 charts should be used with the Cornflower template. Shorter time periods will lead to whipsaws, whereas longer time periods lag behind the market too much.

The following rules are valid no matter the time of day. The quiet of the Asian session actually provides some excellent opportunities for entry, which is a boon for the trader whose day job makes watching the market during London or New York an impossibility.

Pullback (conservative) entry – use hourly chart
·8, 12, and 24 EMAs are all above (long) or below (short) the 72 EMA
·Price has pulled back to the 12 or 24 EMA (the more aggressive the trend, the more shallow the pullback.
·Enter for 20 pips, or hold depending on trader’s judgment of the strength of the trend.

Initial (aggressive) entry – use M30 chart with identical indicators
·Price has moved with authority above or below the 72 EMA. By “moved with authority,” I mean a candle that has closed near the top of its range.
·8, 12, 24 EMAs are all pointed in the direction of price, and preferably already stacked in a perfect order (8 over 12 over 24 for long, 24 over 12 over 8 for short).
·Enter for 20 pips and hold if the thrust develops into a real trend.

Using hourly and half-hourly charts, 20 pips is a realistic initial profit target, especially if one is trading GBPUSD, GBPJPY, or EURJPY. Even the other major pairs should yield this much on a properly gauged signal. By “major,” I mean EURUSD, USDCHF, AUDUSD, USDJPY, NZDUSD, and USDCAD. With the possible exception of EURGBP, any pair that involves two of the seven major currencies should be tradable with this system. Cornflower is particularly well-suited for entering long positions on the yen crosses (carry trades).

Entries may be timed more precisely with a 5M timeframe. More on this later.

-felicia- www.forexfactory.com

Wednesday, January 24, 2007

Part Time Wealth Building Trading System

This forex trading strategy which is great for people who work full time but want to build a very lucrative part time forex trading addiction into full time profession from the comforts of their job:

1. 30 Min chart

2. 5 Period SMA

3. 45 RSI

4. 21 Average True Range (This is a volatility metrics to help determine lot size)

5. Use a 50 PIP stop.


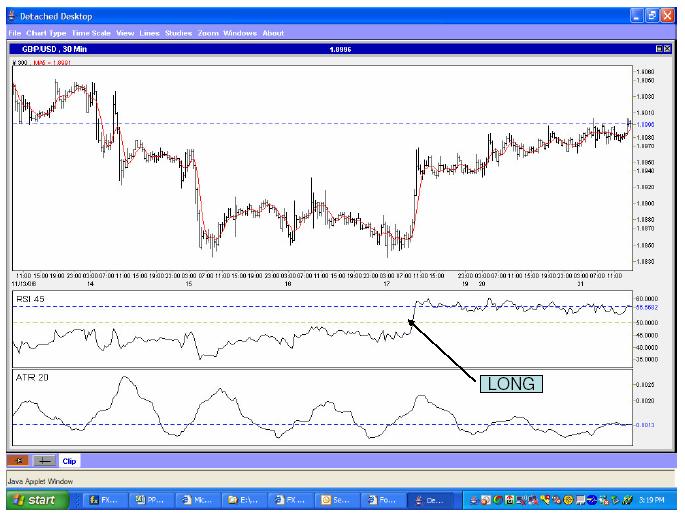
Get Long (buy) position when the price exceeds the SMA by 5 PIPS for the first time and the RSI is greater than 50. Get Short (sell) position when the price fall below the SMA by 5 pips for the first time and the RSI is less than 50. The target for this system is always 200 PIPs (which I am currently enjoying with the GBP/USD).


Example:


The ATR is used to determine lot size. Lot size or Money Management is by far the most important concept to trading.


Happy Trading,


Tkimble (from ForexFactory.com)

Saturday, January 13, 2007

Bunny Girl (BGX) System

Bunny Girl Siytem use is the famous one in forex online trader, her system has been used by many trader in forex online trader. This is her setup;

Chart Setup
· 30 minute, candlestick
· WMA 5
· WMA 20
· WMA 100
· RSI 14

Go Long
· WMA5 Crosses above WMA20
· WMA5 and WMA20 above WMA100
· RSI signals divergence or is above 50

Go Short
· WMA5 Crosses below WMA20
· WMA5 and WMA20 below WMA100
· RSI signals divergence or is below 50

Filters
· Use a filter to eliminate frequent stops and catch the trend at the right time
· EURUSD: 25 points plus the bid/ask spread
· Other recommended pairs: 30 points plus the bid/ask spread
· These filters can and do change
· Cancel the trade if the filter price has not been reached before 5 minutes remaining on
the 30 minute bar.
· Filters on other pairs can be determined (see "Advanced Topics")

Orders
· If bull cross, place a buy stop order at the filter+spread.
· If a bear cross, place a sell stop order at the filter+spread.
· When the filter price is reached and the order engaged, place a stop loss at about the original crossing. (Can goas much as pips away on the other side of the crossing.)


Stop Loss
· 5 pips beyond the cross (or bounce) price

Trading Around Daily Open
Daily Open = open price at 00:00 GMT. Make sure there is room enough for profit targets between filter (entry) price and daily open. If the cross is on one side of the daily open and the filter is on the other, than this is OK to trade. Additionally, the best signal to receive is when multiple pairs are crossing at the same time.

It's simple but poweful. Try this !