Wednesday, June 27, 2012

Swing Trading with Heiken Ashi and Stochastic System

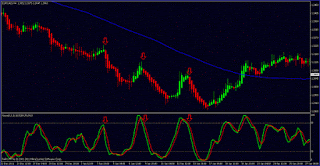
This forex strategy deceptively simple but profitable basic on trend following system. It uses a few of indicators work good on 4 hour charts but other people are using other timeframes successfully.

Indicators you need;
  • Heiken Ashi candles 
  • SMA 100 Close 
  • Stochastic 8,3,3 low/high

Heiken Ashi candles are "average price" candles. They are calculated using a moving average and change colour according to that average. The open, high, low and close of these candles represent slightly different things to normal candles and the best way to get a feel for them is to put them on your chart and see how they look. If you have metatrader you can go to a line chart and then set line chart to "none" in the chart properties and that gets rid of the line leaving you a nice blank screen to put your HA candles on. Notice how the candles can sometimes stay one colour for a long period of time, hundreds of pips on a 4 hour chart. Catching and holding on to these long trends can be very profitable but of course it is not always as easy as all that!

The 100 sma is there to help visualise the trend. As a basic rule of thumb if the price is above the ma the trend is up and we only want to buy and below is down and we only want to sell.

The stochastics give us information about the strength of the pullback in the trend. I find stochastics to be the best momentum based oscillator to help visualise turns in the trend and they work very well with HA candles.

Basic Method 

In an uptrend you want to see a move up followed by a smooth decline in prices signified by green HA candles followed by red. When the HA candle turns back to green and the stochastics make a nice smooth cross towards the bottom of the stochs window then wait for the 4 hour candle to close and open your long trade. In a downtrend you want to see the opposite.

Money Management, Stops and Targets

There is some combination for the best stop loss and target combination to use to capture the most profit from these signals. There are 3 basic methods that I believe are worth testing.

  1. Enter the trade with a 50 pip stop loss. Hold the trade open until the HA candles turn back against the trend moving the stop loss behind the trade as it moves. 
  2. Enter the trade with a 50 pip stop loss and a 50 pip take profit moving the stop loss to +1 pip after +25 pips is reached. 
  3. Enter the trade with a 50 pip stop loss and take half profit at +25 pips moving the remainder to break even at that point and trailing the stop loss as the trade progresses. 


That's all, need more information of this forex strategy please visit FF forum

Friday, April 27, 2012

Darkonix's Forex Trading System

This forex system is mainly configured for EUR/USD in 15 minutes and It's made from following indicators: NonLagMA v7.1_emailalert (length 40 , Pct filter 0.5) and  SSL_fast_sBar_alert_mtf  (lb 10 , time frame 240) (will act as filter for NonLagma) and in a addition StepStopExpert_v1.1 EA for exits. In order to understand better the Darkonix Forex System we'll attaching the screenshoot together with the following guidelines.

Go Short : When NonLagMA send the signal for changing the direction to down trend (red color) and SSL is red (on 4h time frame will act as filter)

Go Long : The opposite from short (everything should be green)

Trading rules
  1. Follow the signals received only in between 6h00 GMT - 21h00GMT 
  2. Option "AlertAfterBarClose" in SSL fast sBar should be "true"! 
  3. Never trade against SSL fast sBar indicator color! 
  4. For exits use following choice's: 
  • StepStopExpert EA 
  • Manually set TP60 and SL30 
  • NonLagMA color change 

Darkonix's Forex Trading System


 Target points Modification:
Nonlag moving average is too slow for exits so you can trade as follows: Close 3 positions at +30 pips. Close 2 positions at +60 pips. Close 1 position at +90 pips. Stop loss at -30 pips.

To wrap up, as any other system it has its pluses and minuses and it does not represent holy grail but if system is used properly and all rules are followed can have winning rate of 80-90% with very low draw down in pips.''


Download Darkonix Forex Indicators

Sunday, April 22, 2012

Andrew Forex System

Andrew forex system using Supertrend and Nonlagdot as indicators.  They do not repaint and do not lag except for the current candle (bar), as well as any other indicator (including the moving average, Stochastic or RSI). This forex system is simple and effective without unnessary additional bugs and troubles. The market should be seen clearly to trade and give the predicted profit.

Rule: 
  • Currency pair: any, but better cross-pairs that give good trends. 
  • Time frame: any, but usually 4-hour 
  • Indicators: supertrend, nonlagdot (value: 20)
Entry rules 

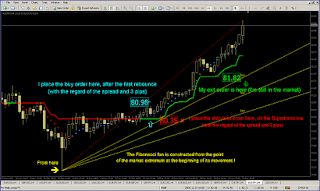
Buy: A dot of Nonlagdot changes from red to blue. At the same time dots of nonlagdot should be above the Supertrend line. Also the Supertrend line should be green. A position should be opened by execution of a pending order. The order is placed on the upper point of the market extremum, which is formed after the first rebounce of the market downward (when closing price is lower than previous one). That is one should wait untill the price has exceeded the point of extremum, and only then buy. However, if the price fails to exceed the level of the point of extremum, one should wait. After the formation of a new point of the market extremum, the order should be shifted to that point. If the color of nonlagdot or supertrend changes to red, the order shoud be canceled.

Sell: A dot of Nonlagdot changes from blue to red. At the same time dots of nonlagdot should be under the Supertrend line. Also the Supertrend line should be red. A position should be opened by execution of a pending order. The order is placed on the lower point of the market extremum, which is formed after the first rebounce of the market upward (when closing price is higher than previous one). That is one should wait untill the price has exceeded the point of extremum, and only then sell. However, if the price fails to exceed the level of the point of extremum, one should wait. After the formation of a new point of the market extremum, the order should be shifted to that point. If the color of nonlagdot or supertrend changes to blue, the order shoud be canceled. Market entries without placing pending orders are not recommended. Pending orders for market entries are placed with the regard of the amount of the spread and additional 3 pips.

Exit rules 

Exit from trade when:
  1. The price touches the Supertrend line, or 
  2. The Supertrend line changes its color, or 
  3. The price touches the first line of the Fibonacci fan. The Fibonacci fan is constructed from the point of the market extremum at the beginning of its movement and up (or down) to the opposite extreme point of the current market, that is, from the bottom to the top of the movement (when buying) and from the top of the movement to the bottom (when selling). It is important not to confuse: the Fibonacci fan is constructed not from the market entry point, but from the point of the beginning of directional movement or trend (up or down). Fibonacci fan line, which is closest to the price, serves as the exit level. And the exit order should be moved on this line. 

Stop-loss is set:
  1. On Supertrend line, or 
  2. Below near price swing, or 
  3. Under (over) the closest extremum of the market, which exceeds the Supertrend line in the opposite direction. 

Stop-loss order is placed with the regard of the amount of the spread and additional 3 pips.

The following money management is recommended: either not more than 10% of the capital per trade, or a progressive system (e.g. Fibonacci or semi-martingale). Martingale is not recommended because it is far too risky in case of the lack of capital after several consecutive losing trades.

Adding is recommended solely to profitable positions after the regular change of Nonlagdot color in the direction of the current trend.


Andrew Forex System


Andrew Forex System

 Download template and Indicators HERE

Source and Credit to Forexfactory.com

Sunday, March 25, 2012

Scalping 10 Pips Only Forex Strategy

This 10 pips forex strategy is scalping strategy very easy and simple to do, even if you are a beginner in forex trading. Use only Bolinger Band and Stochastic to predict price movements in the future. Although a simple strategy, but the author of this forex strategy claimed that it has a good profit.

Setting on your trader platform

  • Time Frame 15 or 30 M
  • Bollinger Bands Default settings
  • Stochastic 5,3,3 with level 20 and 80

That's all you need, remember because this's a scapling strategy so applies only to the currency pairs with low spreads.

Buy Order

When price out under line of bollinger bands, the price will come back in bollinger again
when the first candle close in bollinger Prove the intersection of lines in the indicator stochastic open order buy and your target be 10 pip only.

Scalping 10 Pips Only Forex Strategy


Sell Order

Do the same Buy Order with the opposite way

Scalping 10 Pips Only Forex Strategy


Source: Forum MT5

Tuesday, October 18, 2011

Magic Breakout Forex Strategy

A breakout signal occurs when the price breaks a significant high and makes a new high. This is the definition. Another breakout occurs when the price breaks a significant low and makes a new low. Magic Breakout Forex Strategy is a simple system, It is easy to use but gives impressive results on forex trading.

Setup and Indicators for Metatrader;

  1. Timeframe 1 Hour Chart
  2. Pair GBPUSD or other currency pair
  3. CCI 20 (Commodity Channel Index, Period 20, Typical Price)
  4. EMA34 High, EMA34 Close, EMA34 Low. This three EMA-s will be treated as one indicator called The Wave. We will call them Wave-top, Wave-middle and Wave-bottom.


The Wave is a great tool that helps us to determine the trend. This is description to determine trend using The Wave;
Uptrend: The price has already crossed the Wave upward and the price is above the wavebottom at this moment.
Downtrend: Similarly, the market is trending down if the price is below the the Wave-top.


Long Entries

  • Be sure that the market is trending up.
  • Price was above the Wave for some time. (above the Wave-top)
  • Price entered the Wave. Price was above the Wave and then crossed the Wave-top downward.
  • CCI crossed +100 line upward; A POSSIBLE LONG ENTRY SIGNAL on the next candle open. This is a good signal to go long on the next candle open. But be careful...
  • “Five bars check” rule. Check that CCI was below the +100 line for at least five bars before the cross.
  • Check that the market is trending up now. Check that the price is above the Wave-bottom as with the first rule.
  • Buy now! If all above is filled, buy as new candle opens.


Simply said, price entered the Wave and then returned back up. But this sentence sounds too subjective. We have put it all into mechanical rules that are easy to follow.
Don't enter the market when you “feel” that the price is going up again. Some traders do so, but they get stuck when the price plunges lower! Don't rely on the standard breakout system. The breakout may be false. Enter only if CCI crossed the line! Look at the picture carefully. Do you see that we have entered the market before the breakout... before the crowd?! Do you see the great advantage of the MagicBreakout strategy?

Short entry:

  • CCI crossed the -100 line downward.
  • Look at CCI when the candle has closed. Was it above the -100 line for at least five bars? Is it below the -100 line now? If yes, continue to the next step. We have to check market conditions. Is price trending down? Is price below the Wave-top? (Stick with our definition! Don't let your feeling or intuition to define the trend! Trend definition is a mechanical task here, although sometimes counterintuitive.) If yes, go to the next step.
  • Do you see a valid swing pattern? Train your eyes on the first few trades and you will see the swing pattern subconsciously without reviewing the rules. Review: price was below the Wave and then entered the Wave (in other words, price crossed the Wave-bottom upward). OK?
  • Sell now! And prepare your exit targets...


Exit rule


Plan your trade, trade your plan. Let's assume we have opened a long position. We must take care about
profit target and stoploss right after entry.

  • Place the first profit target (sell-limit order) at 1.618 Fibonacci level;
  • Place the second profit target (sell-limit order) at 2.0 Fibonacci level;
  • Place stoploss (sell-stop order) at 0.0 Fibonacci level.

As the price hits our first target, close a half of the position (so we recommend you to trade at least two
lots/minilots). As the price hits our second target, sell the rest. Place stoploss just two pips below the
0.0 level. The low acts as support and if broken, the trend is probably over.


Exit from a short position:

  • Place the first profit target (buy-limit order) at 1.618 Fibonacci level;
  • Place the second profit target (buy-limit order) at 2.0 Fibonacci level;
  • Place stoploss (buy-stop order) at 0.0 Fibonacci level.

More complete instruction please download and read free Magic Breakout Forex Strategy eBook 

Tuesday, July 19, 2011

S'ema Forex Trading Strategy

This forex strategy called S'ema because it uses a combination of several indicators like ema and sma forex trend line. S'ema currently in stages of development and is been testing. So far it works well and effective in predicting price movement of any currency pair. During ranging/consolidation market the result is quite good, and when market in trending the forex strategy give a better results.

S'ema forex strategy works effective in almost any currency pair so far. In any chart time frame. Recommended to use in 15 min time frame and use 4H chart to see of the overall trend. But not recommended for use trading longer than day-chart.

Set up for S'ema forex strategy:

  • Candle stick
  • BB(14,2)
  • EMA(10)
  • EMA(20)
  • EMA(50)
  • EMA(100)
  • EMA(200)
  • STOCH, FULL (14,3,3)
  • ATR (14)

Long Position:
  1. See uptrend by direction of EMA's: open up in the same direction, at least EMA (200) is underneath
  2. In Stochastic, crossover below 20 line
  3. Crossover of EMA(10) SMA(14) (EMA should cross over SMA upwards)
  4. Close of the entire candle stick above and after crossover of EMA(10)&SMA(14)

Trigger: The close of the candlestick

Target: Recent swing high OR next 00/50 number (i.e. 1.4000, 1.4050)

Stop: The price of swing low extended with ATR(14) value. (i.e. swing low is 1.4089, and ATR(14) is 14; then, the stop is 1.4075)


Short Position:
Do the opposite. Stochastick must have crossover above 80 line. And Candlestick must close below the MA crossover.


Volatility: More distance between EMA's, more volatile.
Note: that in high volatility, it's ok to get in trade even if the only body part of candle is above the crossover.

Trendiness: More EMA's are in same direction, more trendy.
Note that if the price movement is so trendy (a.k.a. all EMA's are in same direction and fanning out upwards), it's ok to be greedy for the take profit (i.e. skipping one 00/50 value).

For really greedy trader and risk taker, it's not too bad to trade with this S'ema forex strategy against the trend as long as for the short term (i.e. 15-min chart).

Source: Babypips.com

Monday, June 27, 2011

5M Kevinator Retracement Forex System

5m Kevinator Retracement Forex System is a forex strategy that is run based on the trend by using the multi time frame stochastic indicator see the current market trend. This forex system was used for major currency pairs only (EURUSD, USDCHF, GBPUSD, AUDUSD, USDCAD) in 5 minutes chart only. If the market is stepping up then you take buy retracement bars.If the market is stepping down you take the sell retracement bars.

Retracement bars are the magneta (purple) bars on the indicator on the bottom. If the market is stepping down you take the downward magneta bars as entry. If the market is stepping up you take the upward magneta bars as entry.

Longterm
You can either enter the market (long term) when the mtf stochastics is changing directions and hold until trend is done or at any of the retracement bars going in the direction of the trend and hold (20-400 pips).

Shortterm
You can scalp the market by finding the direction of the current trend (stepping up or stepping down) and entering the retracement bars and taking 5 to 20 pips profit.

There are two ways to trade this system but the entry rules are solid.We have a solid method to define a trend (mtf stochastics) and a solid entry method ( enter on retracements).

It is up to you how much profit you take as you could be following a trend for days or just scalping all day long for short profits.

5M Kevinator Retracement Forex System image 1

5M Kevinator Retracement Forex System image 2

5M Kevinator Retracement Forex System image 3

If you're interested by this forex system download 5M Kevinator Retracement Forex Indicator here DOWNLOAD

Source: Forexfactory.com