Showing posts with label Daily Strategy. Show all posts

Wednesday, August 20, 2014

The Bladerunner Forex Strategy

The Bladerunner forex strategy is a price action trading so it using tools like candlesticks, pivot points, round numbers and support and resistance levels when trading this strategy. But you can add more indicators if you think that they're useful or you feel more comfortable having some extra confirmation.

In this article we use the 20 EMA for confirmation indicator. Another alternative is to use the midline of the standard 20 Bollinger bands. Either works well, in fact you can use both to trade it as a Bollinger band EMA strategy.

The Bladerunner forex strategyp can be traded on any pair. It can also be traded on any time frame, but the examples below are from 5 min charts.

It can be traded at almost any time of the day, but obviously some times are more reliable than others. For example, the early part of the Asian session may provide a decent break out and retest giving an entry, whereas the Asian afternoon session can be very slow. Then, when London opens the price may be too erratic and volatile to give any reasonable entries for any strategy.

Later again, after the initial flurry of news announcements has passed and price has settled, you may once more get a reliable entry or two. You will therefore have to adjust this strategy to the times when you are able to trade it.

The strategy is named Bladerunner because the 20 EMA acts like a knife edge dividing price. If price is above the EMA, and respecting it, and retests the EMA, it will likely reject to the long side. And if price is below the EMA, and respecting it, and retests the EMA, it will likely reject to the short side. A few examples might help to clarify:


If price is below the 20 EMA, our bias is short and we would be looking for price to move up and hit the 20 EMA, reject and then move down.

However, if price pierces the 20 EMA and closes convincingly above it, we deem price to have switched polarity and now our bias changes to long. (This can be seen occurring at the right of the above picture). From now on we would be looking for price to move down and hit the 20 EMA, reject and then move up.

An example of one definite and one possible losing trade:


Essential entry parameters for this setup are:

  • Price must break out of consolidation or a range prior to entry, i.e. it must be trending
  • Price must then retest the 20 EMA successfully


What constitutes a successful retest?

If price is above the EMA it must bounce from and stay above the EMA; and vice versa for when price is below the EMA. More specifically: The first candle that touches the EMA should close on the same side of the EMA as it approached it from.

This then becomes the signal candle. Price has now rejected from the EMA and we are looking to see if the next candle confirms the move. If the next candle continues the move away from the EMA then this candle becomes the confirmatory candle. This is a simple way to trade the strategy; if you want to play it safer you could insist on a recognisable forex candlestick pattern occurring to confirm the trade.

n.b. if the Bladerunner seems simplistic, it is because forex price action and current fundamentals are factored into trading decisions. No entry is ever taken based purely on price having rejected from the 20 EMA.

Impotant Notes:

  • Always look for a confluence of reasons to enter the trade. For example, it’s safer to have more than just a rejection from the 20 EMA. Ideally, you would like to see this happening at the same place as an old support/resistance level, pivot level or other significant price impact point.
  • Always be on the lookout for impending news announcements when trading this setup, especially on the lower time frame charts. I generally will not enter any trade within 30 to 45 mins before a scheduled news event, and will always wait at least 15 mins after the event before considering a trade.
  • Always trade with the direction of the current trend, as determined by which side of the EMA or polarity indicator price is currently on.


Order Placement:

(Note: the following parameters call for spreading your entry across two orders, but nowadays I have found that it is simpler for me to just enter one position/order per trade. However, many traders prefer to have their trade split across two positions, as this enables them more flexibility in their exits.)

A suggested approach is to open 2 orders when trading this strategy. The orders are as follows:

For a long entry:

  • 2 buy stop orders are placed with entry 2 pips above the confirmatory candle.
  • Orders expire at the start of a new candle. For example, if entering limit orders on the five-minute chart, those orders will expire at the start of the next five-minute candle, unless they have already been filled by price action on the current five-minute candle.
  • The stop loss is placed 2 pips below the signal candle that touched the 20 EMA. This particular rule is not set in stone, you may place the stop behind a recent swing point if you believe that would give a more realistic stop size.
  • The take profit for the first order is set at an amount equivalent to the risk in pips. For example, if the risk in the trade is 20 pips, the first order’s take profit target will be set at 20 pips.
  • The take profit for the second order is set at an amount equivalent to double the risk in pips. So, to use the above example, the take profit on the second order would be set at 40 pips.

For a short entry:


  • 2 sell stop orders are placed with entry 2 pips below the confirmatory candle.
  • Orders expire at the start of a new candle. For example, if entering limit orders on the five-minute chart, those orders will expire at the start of the next five-minute candle, unless they have already been filled by price action on the current five-minute candle.
  • The stop loss is placed 2 pips above the signal candle that touched the 20 EMA. This particular rule is not set in stone, I may place the stop behind a recent swing point if I believe that would give a more realistic stop size.
  • The take profit for the first order is set at an amount equivalent to the risk in pips. For example, if the risk in the trade is 20 pips, the first order’s take profit target will be set at 20 pips.
  • The take profit for the second order is set at an amount equivalent to double the risk in pips. So, to use the above example, the take profit on the second order would be set at 40 pips.


Trailing stop:

Once price has moved in favour of the trade by an amount equivalent to the initial risk, one of the orders is closed (due to its reaching take profit 1 level) and the stop loss on the remaining order is moved to breakeven. Using the above examples, once price moves 20 pips in favour of the trade, the first order is closed and the stop loss on the remaining order is set to breakeven.

This remaining order’s stop is then left at breakeven until the market closes the trade, either by reaching the profit target or by stopping out at breakeven. Again, this rule is not set in stone: there may be times when you may wish to continue trailing the stop beyond breakeven, for example, when a news announcement is imminent.


Monday, March 3, 2014

Morning 2 Trendlines Forex Strategy

This forex strategy is very simple but it proved give profitable trade. Only use 2 lines trendline tool during in the morning or starting of the day. We recommend you have to first understand how to use the trendline line tools in Metatrader 4. And try this forex strategy in virtual account first before applied for real trading

How to Make Morning 2 trendlines

1. Open MT4 Chart on 1H time frame, recommeded pair are EURUSD or EURJPY
2. Use the line separator period to see prices from day to day
3. Pull trendline from Highest yesterday to the Highest of the first candel on this day.


4. Pull trendline from Lowest yesterday to the lowest of the first candel on this day.


Open Position Rules

After you make 2 trendlines, now wait a second candel close on this day .

1. Open BUY if second candel close above the trendline.
2. Open SELL if second candel close below the trendline
3. If the second candel doesn't close above/below the trendline, then wait for the next candel.
4. Use your money management to take profit and stop loss. You can take profit near supply and demand or support resistance line


Tuesday, February 11, 2014

Tom's Simple 7 Strategy

Tom's Simple 7 forex strategy using EMA indicator setting 7 (close) as a determinant in taking open position. This scalping forex strategy work good on any time frame. It's a simple strategy but good enough to read the direction of price movement. Premises should be combined with higher timeframe. And you can add your indicators if you like.


How to setup the chart:

  • Set a 7 close price EMA.
  • Set a 50 close price EMA
How to Trade

If the 7 EMA is lower than the 50 EMA trade only the short opportunities for maximum risk/reward. So if the closed candles are below the 7 EMA trade short.

If the 7EMA is higher than the 50 EMA trade only the long opportunities for maximum risk/reward. So if the closed candles are above the 7 EMA trade long.


This is a trend-based strategy. The 50 EMA is there to indicate an increasing, decreasing or consolidation trend. I would not be interested in trading this strategy in a period of consolidation.

Warning:
These instructions expect that you have basic trading experience and is not meant to teach or train you in trading derivatives or forex. With that said, you can use this method on any timframe, but since we are differentiating the positions above and below the 7 EMA that means you will have to monitor your trade constantly after you enter it.

Note:
This method was left simple to allow people to use it as I basically set it forth, but also to allow you to adjust it to meet your needs and allow room for your new ideas based on it.

Saturday, March 15, 2008

Forex Moneymaker Trading System

Forex Moneymaker System is a trend following system. The Key components are 4 Indicators.

1. Heikin-Ashi : Visual Confirmation of A Trend or Consolidation. Confirms also when market is in a Range.
2. Stochastic & EMA34 : Indicates market momentum.
3. Aroon: Confirms Trend.
4. ATR : Indicates current market volume.

This system getting around 30 to 150 pips daily on eur/usd, usd/chf and gbp/usd. And get about 1, 2 or 3 signals in a 24 Hour period.

Here is the Moneymaker
Recommended to use Metatrader for my analysis, and use Alpari feed (http://www.alpari-idc.com)because MetaTrader from Alpari site got the most accurate feed for metatrader, others are not reliable, You may try FXDD, heard they are good.

Get the following three custom indicators from metatrader yahoo group,
(http://finance.groups.yahoo.com/group/MetaTrader_Experts_and_Indicators)
1. "Heikin-aishi MOD" indicator : Visual Confirmation of the Current trend and not ranging(Extremely Important).
2. Aroon horn : Confirms The Trend has begun!!
3. Detail Daily pivot : Plots the Pivot and Support/Resistance lines. Very reliable for setting Stoploss.

Setup Forex Moneymaker System
Get all the following indicators to the "Custom Indicator folder and fire up metatrader. Get 30 Minute eur/usd, usd/chf and gbp/usd Chart. plot the indicators as follows,
1. Heikin-aishi MOD, just load it up.
2. Load stochastic with default settings, i.e. 13,3,3 and Hi/Low, Simple setup. and Draw a Horizontal line on Stoc at level 50.
3. Aroon horn -no change just the default indicator.
4. ATR 14.
5. Load up 20,2 Bollinger bands(just for confirmation and for my another system).
6. Draw EMA 34(Red), 55(Blue) & 89(Green) on the Charts

Entry, Buy signal :
1. Heikin-Ashi Candle is a Blue Candle(i.e. Blue Hi/Low Leg inside the candle and candle is a Bull/Hollow Candle)
2. Stoc must be crossing from below the 50 line and just above 50 OR
2a. Current Blue Heikin Candle is just above EMA 34 AND Closed above EMA 34.
3. Aroon horn UP(The Blue line) is on the top and FLAT. i.e. on Indicator level 105.
4. ATR 14 is rising. Must be rising, ATR Level not important, But expect levels to be at 15 to 30 on most signals.

Go long on above Indicator confirmations. Note, On #2 use confirmation from either Stoc or EMA34, one will follow the other on usually the same candle or on the next 30M candle.

Stop :
It's a protective stop and for LONGS it is on 10 pip below the next support line of the current candle. Note, when you
load up "Detail Daily pivot" Custom indicator, it plots the daily Support/Resistance lines for you. I use them for my stops. Also for longs ADD Spread to your stops. If you entry bar on or close proximity to a S/R bar, then you may also use the next Support line +10 pips as your stop. Note stops must be 30+spread or above. i.e. 30 to 65 pips(Usually).

Trailing Stop at B/E on 30 pip profit, Profit at 50 -->get stop to 20, 70-->40, 100-->80 etc.

Exit :
when trailing stop gets hit. If it's a false signal then Stoc crossed down from above the 50 line and/OR aroon up bar crossed the down bar(When u'ar long). if I am in front of the PC then EXIT on plain simple consolidation. When price bars are in consolidation ATR should be dropping.

Sell Signal : Just opposite of above.
I've used this system with eur/usd, usd/chf extensively. I also use it with gbp/usd, but some times I get my stops hit due to high volatility of this pair. I've tried demo with other pairs like Eur/Jpy & Eur/Gbp(Works 65% of the Trades), Aud/Usd & Usd/Cad (works at least 55% of the time). The % results are not backtested but from my actual trades on them.

Another Entry Technique
Use a 5 Minute chart entry on the retracement after the signal occurred. You may have to do this for Gbp/Usd if you get whiplashed.

With this system at least 60% of the time you loose 20 ~ 50 pips of the current trend u'ar following, But I feel it's required to make sure the trend has begun!! I wait for Aroon Up/Blue Line to be On top and Become Flat to go long.

Note on the Daily pivot :
IF price bounce from Daily pivot(If entered close to pivot point), you must get your stops to B/E otherwise look for exits. This is especially applicable for GBP/USD. if your trade is away from daily pivot then look for continuation away from the pivot.


By gfxtrader from www.strategybuilderfx.com

Friday, February 1, 2008

OzFx Forex System

The author of this forex system said this forex strategy has given him consistently profit from forex trading. It was interested because the forex system could potentially result 100 - 800 pips per trade on daily chart. Let us see his system;

Setup:
* Open up a daily chart on EUR/JPY.
* Apply Bill Willam’s Accelerator Oscillator (AC).
* Apply Stochastic with setting 5,3,3 on top of AC. Use the template if don’t know how to.
* Try and use demo MT4 from ODL securities. Every broker has different time when they start a new daily candle.
* ODL seems to have the time that works best. I only use their demo account for charts and place my trades on totally different broker.

Short Entry: RED AC below 0 and Stot below 0
Long Entry: Green AC above 0 and Stot above 0
Exit: OppsiteBuy/Sell signal or as per Money Management.
Filter: Apply 200SMA. If price is below 200SMA then only take short trades. If Price is above 200 SMA then only take long trades.

Money Management:
* Trade with 5 Lots with Stop Loss 100 pips away
* Take Profit on 1st Lot at 50 pips. Move Stop Loss to Break Even (BE).
* Take Profit on 2nd Lot at 100 pips.
* Take Profit on 3rd Lot at 150 pips.
* Take Profit on 4th Lot at 200 pips.
* Let the 5th Lot run until you see an opposite entry signal.

The Risk/Reward ratio turns out to be 1:1 or better depending on your 5th Lot. Since we trade on daily and would only take trades with high probability of success, 1:1 would work just fine.

If you choose to do back-testing then take special care for signals from late November to end of Dec. Low volume during this time of the year creates wild swings.

Spend 2 mins every day to analyze 8-10 of your favorite pairs. Demo it for 2-3 weeks and post the screen shots of your trades for everyone to see and learn.


OzFx
Forexfactory.com

Saturday, November 3, 2007

Daily 95 Pips Forex Strategy

The basis of this system is very simple and has proven to be profitable, though I am adjusting the money management/profit targets.

Overview

This is a pure "set and forget" system where trades are placed at the same time everyday. The option is also there for those inclined to monitor their positions to adjust stop levels as profit targets are reached. Please note that there is currently an Expert Advisor being created that will automate the trading of this strategy, thus keeping to the set and forget objective. Please click on the paperclip at the top right hand side of the screen to find the current versions.

By setting multiple profit targets we are exercising money management, while aiming for 95 pips profit from a 50 pips move in price. We will simply be placing orders 5 pips above the previous days HIGH and 5 pips below the previous days LOW.(Actually, it's more like the previous 17 hrs at 5 pm EST.). Use a 30 pips stop loss for all orders. Orders are placed on Monday, Tuesday, Wednesday, Thursday and Friday.

Execution

1.) At 5pm EST open the 1hr chart (2hrs b4 start of the Asian session) of USDJPY. For those whose brokers spreads are still wide at 5pm EST on Sunday (which is 7am my time on a Monday here in Brisbane), in order to avoid the wide spreads you may need to wait until they reduce to normal before placing the orders for the day. I typically have to wait until around 8pm EST.

2.) Use the high and low of the previous 17hrs. For Mondays orders go back as far as 00:00 EST on Friday for high and low.

3.) Open a total of 6 PENDING orders (for each pair) including 3 BUY STOPS and 3 SELL STOPS that expire within 24hrs (I use 18hrs) as follows:

Buy/Long Orders:
1 - Entry = HIGH+5pips, Take Profit=15pips, S/L=30pips
2 - Entry = HIGH+5pips, Take Profit=30pips, S/L=30pips
3 - Entry = HIGH+5pips, Take Profit=50pips, S/L=30pips

Sell/Short Orders:
1 - Entry = LOW-5pips, Take Profit=15pips, S/L=30pips
2 - Entry = LOW-5pips, Take Profit=30pips, S/L=30pips
3 - Entry = LOW-5pips, Take Profit=50pips, S/L=30pips

That's it!

Once you have placed your orders you are free to go and do something else with your day as this strategy does not require you to be monitoring the trades. Though, as already mentioned, to maximise results you may choose to adjust stop levels when profit targets are reached.

There can be 4 possible outcomes after either the long or short trades are triggered:
1.) All 3 profit targets are reached for a total of +95pips.
2.) The first 2 profit targets are reached (+45pips) and the remaining lot is stopped out (-30pips) leaving a total of +15pips.
3.) The first profit target is reached (+15pips) and the two remaining lots are stopped out for a total of -45pips.
4.) All 3 lots are stopped out for a total of -90pips.
Additional to this is the variable outcomes of when both the long and short trades are triggered.
Also note that for those so inclined to monitor the trades, stop levels may be adjusted on remaining lot/s to protect already achieved profits. Trailing stops may also be used at your discretion.

Please note that as a general rule of thumb you should not risk any more than 3% of your trading account on any one trade. Therefore, with the DAILY95PIPS strategy the order size will need to be divided between the long and short orders. The total potential loss on the long orders (90pips) will therefore add up to 3% of your trading account. Alternatively, you could risk 3% of your trading capital on EACH order, totalling 9% of your trading capital being risked for the long trades. The same applies to the short orders.

By: mikelath
www.forexfactory.com

Friday, May 25, 2007

The Daily Fozzy Method

The daily fozzy method is another forex system which is a low maintenance and very easy to follow. It was started on Forex Factory by Fozzy from Australia. He developed this strategy on his own, and it targets those who cannot sit in front of their computers all day, just waiting for signals. All it needs from you is a 10 minutes every day.

Fozzy Method only trade daily charts and only EUR/USD, GBP/USD, USD/JPY and USD/CHF. Why these? Primarily because these are the only ones Fozzy has backtested and He has been trading for the last 3 months. He also tend not to trade Monday mornings (Australian time) as prices sometimes gap over the weekend. However, this is discretionary.

On each chart He has an 8 period RSI. He has also has an 8 period MA of the RSI and Bollinger Bands with a 20 period setting, also on the RSI.

Long Entries: When RSI below the middle Bollinger Band. Enter long on the open of the next bar after the RSI has crossed MA from below to above.
Short entries: When RSI above the middle Bollinger Band. Enter when RSI crosses MA from above to below.

Stop loss is the low/high of the previous bar. Move S/L to break even if the price moves greater than 40 pips in Our direction. After the initial 40 pip move use a trailing stop for exits (25 pips).

Fozzy only look at the charts once per day, just before 0.00 GMT. This way He knows which pairs are approaching his set-up. Then place trades if the criteria has been met. That's it.

A simple system that seems to work for him. This method provides a limited number of trades but the trades can last anywhere from 1 day to numerous days. There can also be days on end with no trades. He has found that the secret is have patience. He also have come to believe those who say longer timeframes are easier, especially for newbies.

He said "This system will not always work but for me it has generated over 400 pips in September already. Please try this out on demos before putting your hard-earned into it. Just because it is working for me (at the moment) does not mean it will suit everyone".

Tuesday, February 13, 2007

Galveston Forex - 5 Minute Chart Trading Strategy

Rules of Engagement of Galvestone Forex Trading System :

1. The range of your last few high/low points is more than 20 pips. High/Low points on our charts are indicated by the red (high) and blue (low) circles. (also called “Mouteki 2 bar high/low points”) These are a high or low point with two bars on each side of them that didn’t make a new high or new low. We don’t use all red and blue circles when deciding if 20+ pips has been reached, we mainly use the points that have shown very little retracement. The exception to this rule is only if your potential trade is in the direction of the overall trend. If so, less than a 20 pip range could still be acceptable, provided the other variables match.

2. Trade the right side of the range. If you are planning to go long, your entry would be in the bottom half of the range between your last few high/low points-closer to the low of the range. When shorting a currency, it would be the top end of the range. If you are in the direction of the overall trend then this rule is less important.

3. Before placing a trade, wait for a breakthrough of any decent support or resistance that’s nearby. Ideally, we like to see double confirmations. If there is a break of the trend line, we like to wait for a break of the nearest support or resistance as well. We do this to avoid reversing our position on what is likely a small retracement. On our chart we have two examples of this. The first trade breaks the trend line followed by a breakthrough of the resistance. The second trade breaks through the support and then the trend line. During the upward move, we also have retracements that break the trend line, but not the support line, therefore we never reversed our trade.

4. Draw smooth trend lines-use clean points with no previous breakthrough. This is important because we think that once the price passes through it, the integrity of the trend line has been weakened. Once a price breaks through our trend line, we modify our trend line according to the previous break. We take our original point and use the high or low of the violation bar as our next point. We then draw a trend line between the old line and the new line, because we would still consider entering that trade on a double confirmation. If the trend line is strong, and the price pulls away from it, only to come back and pass through it, we don’t need a double confirmation. We would consider entering the trade without it, if there are no support or resistance points in the area around the breakthrough.

5. If our trade is going really well, and the trend line looks pretty steep, we often change our strategy a little. We would not be looking to stop and reverse as usual, but be more concerned with not giving back all of our profits. If your price targets have been reached or you feel you are coming up on a strong support or resistance, then feel free to exit the trade. We like to give the trade a chance, usually waiting for a trend line violation or an opposite support or resistance break though. Sometimes there will be no mouteki price points or trend lines in the immediate area, so we look for technical reversal points to exit our trades with still a decent profit while at the same time giving our trade room to breathe.

6. Be conservative on choppy days or days when bars have consistent long shadows. The Forex usually follows some daily pattern, until, of course, it is broken. Because of that some days will be very easy to trade and profitable, and others will be difficult. For the most part the market will be fairly easy to trade and profit from because of the very large daily pip range. The sooner we recognize the type of market we are in the sooner we can adapt our trading strategy to it. One way we can “adapt” is by utilizing smaller stops when the market is trending tightly, and using better positioned stops when the market is more volatile. If we see a ranging market, then we can look to enter on a single confirmation closer to the top or bottom the range. It is easy to trade according to rules, however it is more difficult to recognize and adapt to the current market conditions. By using adaptive rules we can better play specific market conditions.

7. Use technical points for stops. There is no need to risk more than 15 pips on a trade when using a 5 minute chart. If you decide the risk is worth the reward then virtually any stop can be justified, but be aware of the next major support or resistance, as that will likely be your first target or obstacle. Ideally, our stops will be on the opposite side of the top/bottom range point nearest to our trade. If this is not possible then we will try and place our stops just beyond the nearest support or resistance levels that we can find that are within reason. Remember to add your spread (2 pips) and a buffer zone (1-3 pips) to the support or resistance you chose to put your stop behind. The basic idea is that our trades have 3 possible scenarios, 2 of them going our way. The trade could move against us and break out past our technical point; we lose. The trade could move against us, hit our technical point and reverse back, moving our way; we win. The trade could move in our direction; we win.

8. Managing stops can be the biggest determinate between making money and losing money. If we trail our trade tightly, we increase the chance of making a small profit, but reduce the likeliness of making a big profit. Small profits are good, however, if we consistently get stopped out at +5 or so, and are willing to risk 15 pips on the downside, it will be tough to make decent money. More often than not we would miss the big runs. With that said, we need to be intelligent about our stops, both in placing them as well as managing them. Ideally, we just close our trade and take a position the other way. If we are using a trailing stop loss, we need to keep our distance and always place stops behind strong support/resistance points. We trail our stops if we think our stop is in a weak position. The stronger we feel our stop is, the less likely we are to move it (unless the trade moves into good profit.) One strategy that makes stops easier to manage is trading two lots. The first lot we look to exit at the first likely reversal point, thereby locking in profit, (or at least offsetting any potential moves that stop you out.) Trading two positions can free you up mentally by satisfying your need for locked in profits, but also allowing you an opportunity to see your trade run as well.

9. Trading bigger ranges and trading with the overall trend will reduce your risk and dramatically increase the probability of a successful trade. Like we stated earlier trading two or more positions also increases your chance of success. Remember that the trend is more likely to continue than it is to reverse.

10. Do not force or create trades. Wait for the market to dictate when you trade. This rule is the difference between following a strategy and “just winging it”. Modifications can be great, but entering early, really late, or placing large stop losses are recipes for disaster if not thought through.


These Rules of Engagement are based on the results of one lot trading with a few adaptive variables, (e.g. stops and limits.) We have NOT tested trading only with the trend, or trading only large movements. Refer to our recent chart example for a better idea of our strategy.


Additional Information:

Q: When using a 5 minute chart are we not just giving spreads to our broker?
A: That depends on the currency pair. For the EUR/USD, our spread is around 1.5-3 pips, which is a fraction of our allowed stop loss. We want to position ourselves for the larger moves, but even with smaller moves we can overcome a 2-3 pip spread easily. We don’t enjoy paying a spread, but it is a factor that most intraday trading strategies must deal with and overcome.

Q: Why use such a small chart; wouldn’t the 15 or 30 min be better?
A: The 5 minute chart is both the 15 and the 30 minute chart it’s just a matter of how you look at it. Three 5 minute bars are a 15 minute bar, and six 5 minute bars are a 30 minute bar. The 15-30-60 minute charts can’t tell you about a 5 minute chart, and a 5 minute chart can tell you what the 15/30/60 minute charts tell you. That’s why we use it.

Q: Why don’t you use any technical indicators along with your charts?
A: We would be happy to if you know some that would correlate with the strategy that we are trading, and that would act as a confirmation of when to enter or exit a trade. We are trying to keep trading relatively simple; “if this, then that”

Q: Why do you use trend lines along with supports and resistance points?
A: Trend lines give us a glimpse of the possible future, and supports and resistances open or close certain actions within that possible future. The idea isn’t to use a moving average to tell us what we already know; rather the point is to gather information on what we don’t currently know and using that information to predict probable directions of the market.


Final Note:

The point and goal of all of this is to simply make pips, individually and collectively. How we get to that point doesn’t matter, what does is that we make it there. Please test, tweak, develop, and create towards our goal of group success. It is difficult to put onto paper a set of rules that work, because often the market gives us hints on what’s going to happen and opportunities that we could seize but our rules don’t allow for us to do it. It is for that reason that we are working on two other strategies to fill the voids that this one leaves. Our other strategies in progress are for trading supports & resistances and trading range breakouts. You will see that sometimes we miss big trades because we followed our rules, so utilizing multiple strategies just makes sense. We will revise and update these strategy rules in the near future, but for now, please look over this strategy. Test it. Modify it. Do whatever you wish with it! We look forward to any constructive criticism or suggestions or how to make it better. Feel free to stop by our group site or shoot us an email. Thank you for taking the time to read this, have a fantastic Holiday and we wish you the best of luck in 2007.

Galveston ,-

Tuesday, January 16, 2007

Pivot Point Trading

Using pivot points as a trading strategy has been around for a long time and was originally used by floor traders. This was a nice simple way for floor traders to have some idea of where the market was heading during the course of the day with only a few simple calculations.

The pivot point is the level at which the market direction changes for the day. Using some simple arithmetic and the previous days high, low and close, a series of points are derived. These points can be critical support and resistance levels.

The pivot level and levels calculated from that are collectively known as pivot levels.

Every day the market you are following has an open, high, low and a close for the day (some markets like forex are 24 hours but generally use 5pm EST as the open and close). This information basically contains all the data you need to calculate the pivot levels.

The reason pivot points are so popular is that they are predictive as opposed to lagging. You use the information of the previous day to calculate potential turning points for the day you are about to trade (present day).

Because so many traders follow pivot points you will often find that the market reacts at these levels. This give you an opportunity to trade.

If you would rather work the pivot points out by yourself, the formula I use is below:

Resistance 3 = High + 2*(Pivot - Low)
Resistance 2 = Pivot + (R1 - S1)
Resistance 1 = 2 * Pivot - Low
Pivot Point = ( High + Close + Low )/3
Support 1 = 2 * Pivot - High
Support 2 = Pivot - (R1 - S1)
Support 3 = Low - 2*(High - Pivot)

As you can see from the above formula, just by having the previous days high, low and close you eventually finish up with 7 points, 3 resistance levels, 3 support levels and the actual pivot point.
If the market opens above the pivot point then the bias for the day is for long trades as long as price remains above the pivot point. If the market opens below the pivot point then the bias for the day is for short trades as long as the market remains below the pivot point.

The three most important pivot points are R1, S1 and the actual pivot point.

The general idea behind trading pivot points is to look for a reversal or break of R1 or S1. By the time the market reaches R2,R3 or S2,S3 the market will already be overbought or oversold and these levels should be used for exits rather than entries.

A perfect set up would be for the market to open above the pivot level and then stall slightly at R1 then go on to R2. You would enter on a break of R1 with a target of R2 and if the market was really strong close half at R2 and target R3 with the remainder of your position.

Unfortunately life is not that simple and we have to deal with each trading day the best way we can. I have picked a day at random from last week and what follows are some ideas on how you could have traded that day using pivot points.

On the 12th August 04 the Euro/Dollar (EUR/USD) had the following:
High - 1.2297
Low - 1.2213
Close - 1.2249

This gave us:

Resistance 3 = 1.2377
Resistance 2 = 1.2337
Resistance 1 = 1.2293
Pivot Point = 1.2253
Support 1 = 1.2209
Support 2 = 1.2169
Support 3 = 1.2125

Have a look at the 5 minute chart below


The green line is the pivot point. The blue lines are resistance levels R1,R2 and R3. The red lines are support levels S1,S2 and S3.

There are loads of ways to trade this day using pivot points but I shall walk you through a few of them and discuss why some are good in certain situations and why some are bad.

The Breakout Trade

At the beginning of the day we were below the pivot point, so our bias is for short trades. A channel formed so you would be looking for a break out of the channel, preferably to the downside. In this type of trade you would have your sell entry order just below the lower channel line with a stop order just above the upper channel line and a target of S1. The problem on this day was that, S1 was very close to the breakout level and there was just not enough meat in the trade (13 pips). This cab be a good entry technique for you. Just because it was not suitable this day, does not mean it will not be suitable the next day.


The Pullback Trade

This is one of my favorite set ups. The market passes through S1 and then pulls back. An entry order is placed below support, which in this case was the most recent low before the pullback. A stop is then placed above the pullback (the most recent high - peak) and a target set for S2. The problem again, on this day was that the target of S2 was to close, and the market never took out the previous support, which tells us that the market sentiment is beginning to change.


Advanced

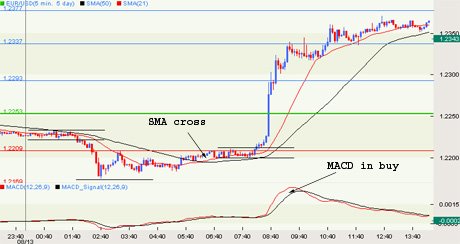
As I mentioned earlier, there are lots of ways to trade with pivot points. A more advanced method is to use the cross of two moving averages as a confirmation of a breakout. You can even use combinations of indicators to help you make a decision. It might be the cross of two averages and also MACD must be in buy mode.

In the example below the market passed through S1 and then retraced to the S1 line again. It then formed a channel. At around this time we had a cross of the averages, MACD signaled buy and there was a breakout of the channel line. This gave a great signal to go long with a target of the original pivot line.

Mess around with a few of your favorite indicators to help determine an entry around a pivot level but remember the signal is a break of a level and the indicators are just confirmation.


We haven't even got into patterns around pivot levels or failures but that is not the point of this lesson. I just want to introduce another possible way for you to trade.

Good Trading
Mark McRae

Saturday, January 13, 2007

Key Features for Shaping a Forex Day Trade

Until recent years, the opportunity to put on a trade was governed by the cycle of day and night. But a unique characteristic of Forex trading is its round the clock sequence of trading. Starting Sunday when the sun rises in Asia, until Friday late afternoon, when the New York markets close, Forex trading is available. So the question arises, what is a Day trade in Forex, if technically Forex is a continuous week of trading? To answer that question we do not need to delve into the nature of human circadian biorhythms. One has to be arbitrary. We can effectively define a Forex day trade as a trade that is completed during the waking hours of a trader. A day trade might also be considered a trade initiated and completed within the trading hours of either the Asian, European, or United States equity markets. One more criteria for calibrating when your Forex Day trading starts can be when you grab that first cup of coffee!

Your State of Mind is a Critical Factor
One of the differences between a beginning and a more experienced trader is their mind-set. In the mind of the beginning Forex trader is the ever present thought: What should I trade today? How do I get my 10 PIPS? In contrast, the more experienced Forex trader is looking to answer a different set of questions- Which pair offers the best opportunity for a winning trade? The beginner wants to jump in, score and get out. The more experienced Day Trader wants to wait for the market to come to them. The beginning trader perceives the Day Trade as a reprieve from analysis, whereas the more experienced trader knows that the trade itself is a result of analysis.

The search for your next Day trade starts ironically by looking backward in time.
We start by looking for the location where the price is probing or testing a pattern; a key Fib Resistance or Support area; trend line or moving average. In a real sense, your next day trade takes its shape days, and sometimes weeks, before the decision to trade. For example, if a currency pair is approaching a key Weekly 61.8% Fibonacci level, while another currency pair is simply moving between Fib levels, the pair that is nearer the Fib levels should take priority. It offers a greater trading opportunity because when prices are at these Fib locations, they are more likely to result a real change in sentiment and trend patterns.

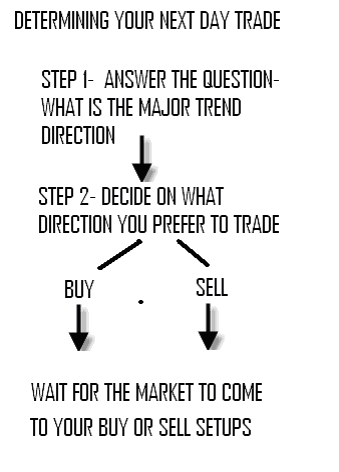
Finding your next Day trade is a result of applying some key decision rules. The actual trigger conditions for the trade will wait for the right confirming moment. However, the chart below outlines the logical steps that go into shaping a Day trade. This chart describes two key steps in arriving at a trading decision. The first step is to answer the question- What is the major trend direction? The trader needs to observe the big picture in getting this answer and assess Weekly, Daily, and 4 hour patterns. The next important step is to decide what will be the direction of the next trade. Will it be a buy or sell? By choosing the direction of your next trade, you are not predicting the market at all. You are waiting for the market to come to you!


Number of Trading Opportunities Per Day Depends on Finding Patterns
An attractive aspect of the Forex market is plethora of opportunities to trade during a day. Let's try to quantify how many good opportunities does the Forex Day Trader have on a given day? A sensitivity analysis would show that we have 6 Big Currency Pairs (EURUSD, GBPUSD, USDCHF, USDJPY, USDCAD, AUDUSD).

At least 2 commonly traded crosses (EURGBP, and EURJPY). This provides 8 currency pairs to provide opportunities for the Day trade. When each currency pair's chart intervals are examined carefully for an evolving trading signal, we have geometrically increased the potential for trades. A Day trade in Forex can often provide more opportunities to trade than available capital in an average account. The trader need not rush to trade, but choose among competing opportunities.

A good rule of thumb for the beginner Day Trader to spot trading opportunities is to use the 4 hour time interval. It represents a decent amount of time for prices to evolve wider ranges that are tradable. During a 4 hour period, currency pairs often exhibit ranges that provide the enough PIP distance between Resistance and Support. to achieve Day trading goals.


So if we estimate that we can expect 2 opportunities per currency pair during any given 4 hour period, we can expect 16 trading opportunities that can justify putting on a trade. If we take extreme rationing of these opportunities and select only 1 trade per 4 hour period per currency pair, we have more than enough to allow a person to take Forex Day trading as a serious opportunity. A common occurrence is a cluster effect where the action in one currency pair cascades across all of them and, suddenly, almost at the same time, there are numerous opportunities! The distribution of trading opportunities, however, is not random, and patience in waiting for the right opportunity is a worthy skill to acquire.


Pulling the Trigger

Putting on the trade, after all, is what the analysis leads to, but it is not a spontaneous event. While there is no single rule of action on what a price trigger is, we can narrow conditions to be such that the trade is reasonable and can be supported by a combination of technical factors. For example, in the chart below, the price is probing the lower channel line and a trade going long would coincide with a confirmation that the position is oversold. Notice that in the example below, Relative Strength Indicator is breaking its own trend line. This is a very useful confirming tool when oscillators are used in technical analysis.


During any given day in Forex Trading, patterns emerge inviting a trade. The skilled trader waits for a high probability trade where confidence is high that the trade will work. Contributing to confidence may very well be the trader's own psychological mind set and optimism. Ultimately, the Profit and Loss Chart will demonstrate whether one is engaged in wishful thinking or a winning game. Whether one looks for a quick grab of profits that will pay for a dinner date, or for a trade that makes the month's mortgage payment, Day trading Forex has embedded in its market patterns, the potential for achieving a variety of trading goals. Forex Day trading offers a range of opportunities but there is an entrance requirement- The Forex trader who wants to be successful needs to come armed with a box of tools, and a set of rules.

by Abe Cofnas

Wednesday, January 10, 2007

Trade Using News: 5 Most Watched Indicators

Currencies do not become weaker or stronger randomly. A large portion of a currency's value is based on confidence in the economic strength of the country. Economic strength is judged by certain key indicators that are closely watched in FX trading. When these economic indicators change, the value of a currency will fluctuate. A currency is a proxy for the country it represents and the economic health of that country is priced into the currency.

Fundamental releases have become increasingly important market movers. When focusing on the impact that economic numbers have on price action in the FX market there are 5 indicators that are watched the most because of their potential to generate volume and to move prices in the market.

Why Does Economic News Impact Short-Term Trading?
The data itself is not as important as whether or not it falls within market expectations. Besides knowing when all the data is released, it is vitally important to know what economists are forecasting for each indicator. For example, knowing the economic consequences of an unexpected monthly rise of 0.3% in the Consumer Price Index, the Actual, is not nearly as vital to your short-term trading decisions as it is to know that this month the market was looking for CPI to fall by 0.1%, the Consensus.

Analyzing the longer-term ramifications of an unexpected monthly rise in prices can wait until after you've taken advantage of the short term trading opportunities presented by the data typically within the first thirty minutes following the release. Market expectations for all economic releases are published on our calendar and you should track these expectations along with the release date of the indicator.

Average Pip Ranges
1.Non Farm Payrolls - UnemploymentAvg. Move: 124 Pips
2.FOMC Interest Rate DecisionsAvg. Move: 74 Pips
3.Trade BalanceAvg. Move: 64 Pips
4.CPI - InflationAvg. Move: 44 Pips
5.Retail salesAvg. Move: 44 Pips

* 2004 Data from DailyFX Research

1. Non Farm Payrolls – Unemployment
The unemployment rate is a measure of the strength of the labor market. One of the ways analysts gauge the strength of an economy is by the number of jobs created, and the percentage of workers unable to find jobs. Strong job creation is indicative of economic growth, as companies must increase their workforce in order to meet demand.Release Schedule: First Friday of the month at 8:30am EST

2. FOMC Interest Rate Decisions
The Federal Open Market sets the discount rate, which is the rate at which the Federal Reserve Bank charges member banks for overnight loans. The rate is set during the FOMC meetings by the regional banks and the Federal Reserve Board.Release Schedule: 8 meetings scheduled per year. Date is known in advance so check the economic calendar

3. Trade Balance
The balance of trade measures the difference between the value of goods and services that a nation exports and the value of goods and services that it imports. A trade surplus results if the value of exported goods exceeds that of imported goods, whereas a trade deficit exists if imported goods exceed exported goods.Release Schedule: Generally released around the middle of the second month following the reporting period. Check the economic calendar

4. CPI – Consumer Price Index
The CPI is a key gauge of inflation, as it measures the price of a fixed basket of consumer goods. Higher prices are considered negative for an economy, but since central banks often respond to price inflation by raising interest rates, currencies sometimes respond positively to reports of higher inflation.Release Schedule: Monthly - around the 13th of each month at 8:30am EST

5. Retail Sales
Retail sales is a measure of the total goods sold by a sampling of retail stores. It is used as a gauge of consumer activity and confidence as higher sales figures would indicate increased economic activity.

Release Schedule: Monthly - around the 11th of each month at 8:30am EST

Source by RefcoFX

Monday, January 8, 2007

Trading With Strategy

Anyone who says you can consistently make money in foreign exchange markets is being untruthful. Foreign exchange by nature, is a volatile market. The practice of trading it by way of margin increases that volatility exponentially. We are therefore talking about a very 'fast market' which is naturally inconsistent. Following that precept, it is logical to say that in order to make a successful trade, a trader has to take into account technical and fundamental data and make an informed decision based on his perception of market sentiment and market expectation. Timing a trade correctly is probably the most important variable in trading successfully but invariably there will be times where a traders' timing will be off. Don't expect to generate returns on every trade.

Let's enumerate what a trader needs to do in order to put the best chances for profitable trades on his side:

Trade with money you can afford to lose:
Trading fx markets is speculative and can result in loss, it is also exciting, exhilarating and can be addictive. The more you are 'involved with your money' the harder it is to make a clear-headed decision. Money you have earned is precious, but money you need to survive should never be traded.

Identify the state of the market:
What is the market doing? Is it trending upwards, downwards, is it in a trading range. Is the trend strong or weak, did it begin long ago or does it look like a new trend that's forming. Getting a clear picture of the market situation is laying the groundwork for a successful trade.

Determine what time frame you're trading on:
Many traders get in the market without thinking when they would like to get out, after all the goal is to make money. This is true but when trading, one must extrapolate in his mind's eye the movement that one expects to happen. Within this extrapolation, resides a price evolution during a certain period of time. Attached to this is the idea of exit price. The importance of this is to mentally put your trade in perspective and although it is clearly impossible to know exactly when you will exit the market, it is important to define from the outset if you'll be 'scalping' (trying to get a few points off the market) trading intra-day, or going longer term. This will also determine what chart period you're looking at. If you trade many times a day, there's no point basing your technical analysis on a daily graph, you'll probably want to analyse 30 minute or hour graphs. Additionally it is important to know the different time periods when various financial centers enter and exit the market as this creates more or less volatility and liquidity and can influence market movements.

Time your trade:
You can be right about a potential market movement but be too early or too late when you enter the trade. Timing considerations are twofold, an expected market figure like CPI, retail sales or a federal reserve decision can consolidate a movement that's already underway. Timing your move means knowing what's expected and taking into account all considerations before trading. Technical analysis can help you identify when and at what price a move may occur. We will look at technical analysis in more detail later.

If in doubt, stay out:
If you're unsure about a trade and find you're hesitating, stay on the sidelines.Trade logical transaction sizes:Margin trading allows the fx trader a very large amount of leverage, trading at full margin capacity (in ACM's case 1% or 0.5%) can make for some very large profits or losses on an account. Scaling your trades so that you may re-enter the market or make transactions on other currencies is generally wiser. In short, don't trade amounts that can potentially wipe you out and don't put all your eggs in one basket. ACM offers the same rates regardless of transaction sizes so a customer has nothing to lose by starting small.

Gauge market sentiment:
Market sentiment is what most of the market is perceived to be feeling about the market and therefore what it is doing or will do. This is basically about trend. You may have heard the term 'the trend is your friend', this basically means that if you're in the right direction with a strong trend you will make successful trades. This of course is very simplistic, a trend is capable of reversal at any time. Technical and fundamental data can indicate however if the trend has begun long ago and if it is strong or weak.

Market expectation:
Market expection relates to what most people are expecting as far as upcoming news is concerned. If people are expecting an interest rate to rise and it does, then there usually will not be much of a movement because the information will already have been 'discounted' by the market, alternatively if the adverse happens, markets will usually react violently.

Use what other traders use:
In a perfect world, every trader would be looking at a 14 day RSI and making trading decisions based on that. If that was the case, when RSI would go under the 30 level, everyone would buy and by consequence the price would rise. Needless to say, the world is not perfect and not all market participants follow the same technical indicators, draw the same trendlines and identify the same support & resistance levels. The great diversity of opinions and techniques used translates directly into price diversity. Traders however have a tendency to use a limited variety of technical tools. The most common are 9 and 14 day RSI, obvious trendlines and support levels, fibonnacci retracement, MACD and 9, 20 & 40 day exponential moving averages. The closer you get to what most traders are looking at, the more precise your estimations will be. The reason for this is simple arithmetic, larger numbers of buyers than sellers at a certain price will move the market up from that price and vice-versa.

by ACM/Refco

Sunday, January 7, 2007

Hans123 Break Out System

Simple Combined Breakout System for EUR/USD and GBP/USD
Determine the 06.00 CET – 10.00 CET High Low on EUR/USD and GBP/USD
Determine the 10.00 CET – 14.00 CET High Low on EUR/USD and GBP/USD
Set BuyStop at High + 5 pips and SellStop at Low - 5 pips for both timeframes and both currencies

Set Target Price at entry + 80 pips for EUR/USD and entry + 120 pips for GBP/USD
Set StopLoss at entry - 50 pips for EUR/USD and entry - 70 pips for GBP/USD. If the other side of the breakout is within 50 pips for EUR/USD or within 70 pips for GBP/USD then the StopLoss will be that level (Longtrade: SL = Low range - 5 pips = SellStop; Shorttrade: SL = High range + 5 pips = BuyStop)

Move the SL to breakeven after a gain of 30 pips for EUR/USD and a gain of 40 pips for GBP/USD

If a certain position is taken and price turns agains you and it breaks the other side of the breakout channel then turn. If the breakout channel is broader then the stoploss first the stoploss will be hit. If the breakout channel is narrower then the stoploss then hitting the other side means that you have to turn your position. There is only one turn per time frame possible
At 24.00 CET all orders expiring and close all trades at market. On Friday we do the same at 23.00 CET.This link displays the time in every major city in the world: www.qlock.com. I am using CET time (Amsterdam, Frankfurt).

Results October
2005:10/03 : -22 pips10/04: -61 pips10/05: -103 pips10/06: +168 pips10/07: +156 pips10/10: +135 pips10/11: +61 pips10/12: +108 pips10/13: +97 pips10/14: +274 pips10/17: +178 pipsTotal: +991 pips

The results this month are extreme. In general the system gives you an average return of 600 pips a month from March 2005.

On monthly basis the results are:
March 2005: +721 pips April 2005: +940 pips May 2005: +296 pips June 2005: +857 pips July 2005: +1,352 pips August 2005: + 35 pips September 2005: -20 pips October 2005: +1,825 pips November 2005: +554 pips December 2005: +345 pips January 2006: +73 pips February 2006: -13 pips March 2006: +633 pips April 2006: +617 pips May 2006: +1,319 pips

All calculations before October 2005 are done by hand, so it is possible that there is a small deviation. It is only to show the power of such a simple system.

Source : Hans123